. 2025 Feb 17;44(1):56.
doi: 10.1186/s13046-025-03274-1.

AZIN1 level is increased in medulloblastoma and correlates with c-Myc activity and tumor phenotype

Affiliations

AZIN1 level is increased in medulloblastoma and correlates with c-Myc activity and tumor phenotype

Julie Sesen et al. J Exp Clin Cancer Res. .

Abstract

Background: AZIN1 is a cell cycle regulator that is upregulated in a variety of cancers. AZIN1 overexpression can induce a more aggressive tumor phenotype via increased binding and resultant inhibition of antizyme. Antizyme is a protein that normally functions as an anti-tumor regulator that facilitates the deactivation of several growth-promoting proteins including c-Myc. MYC plays a critical role in medulloblastoma pathogenesis. Its amplification serves as a defining characteristic of group 3 medulloblastomas, associated with the most aggressive clinical course, greater frequency of metastases, and shorter survival times.

Methods: Medulloblastoma tissues (68 TMA, and 45 fresh tissues, and 31 controls) were stained (fluorescence and immunohistochemical) for AZIN1. Western blotting and ELISA were used to detect the AZIN1 level. Phenotypically aggressive cellular features were measured by increased invasion, colony formation and proliferation. CRISPR-Cas9-mediated AZIN1 knocked-out cells were orthotopically implanted in the cerebellum of nude mice (n = 8/group) with a stereotactic frame. Tumor growth was monitored using the In Vivo Imaging System (IVIS).

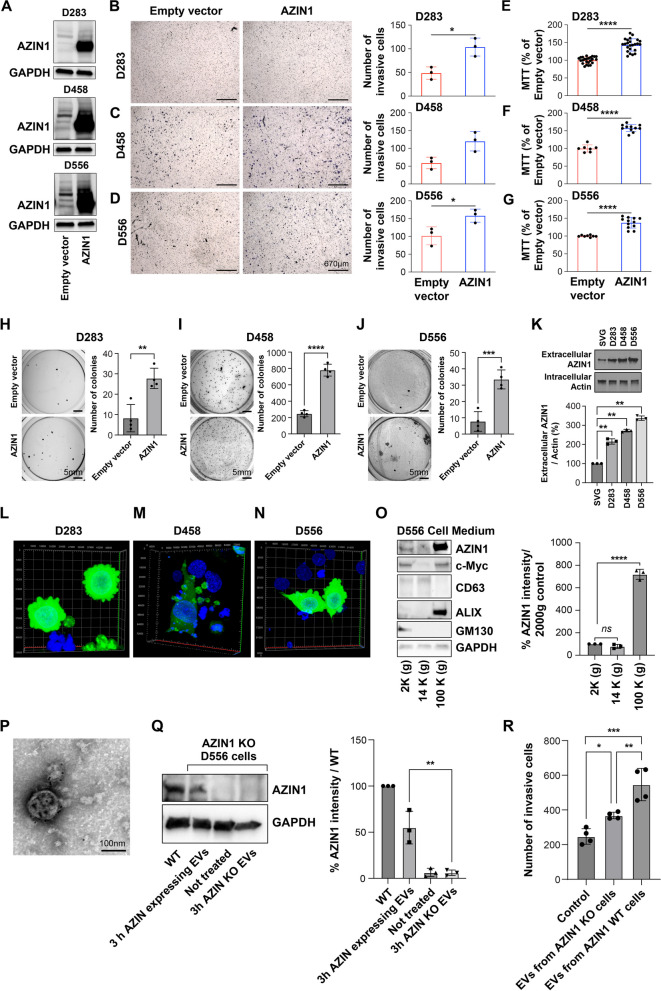
Results: Here, we investigated the role of AZIN1 expression in medulloblastoma. We found that overexpression of AZIN1 in medulloblastoma cells induces phenotypically aggressive features. Conducting in vivo studies we found that knocking-out AZIN1 in tumors corresponds with reduced tumor progression and prolonged survival. Clinical specimens are revealing that AZIN1 is highly expressed and directly correlates with MYC amplification status in patients.

Conclusion: These data implicate AZIN1 as a putative regulator of medulloblastoma pathogenesis and suggest that it may have clinical application as both a biomarker and novel therapeutic target.

Keywords: AZIN1; Extracellular Vesicles; MYC amplification; Medulloblastoma; c-Myc.


Conflict of interest statement

Declarations. Ethics approval and consent to participate: Animal experiments were conducted in compliance with protocols established by the Institutional Animal Care and Use Committee (IACUC) of Boston Children’s Hospital for ensuring animal welfare and minimizing discomfort. The animal ethical clearance protocol number used for the study was 00002258. CSF, tissue and urine were collected in accordance with protocols approved by the Boston Children’s Hospital IRB (IRB#10-417); informed consent was obtained. Tissue microarray, on a slide containing 47 cases of MB was obtained in accordance with protocols approved Children’s Oncology Group (COG) (approved protocol number: ACNS20B1-Q). Consent for publication: Not applicable. Competing interests: The authors declare no competing interests.

Figures

Fig. 1
Fig. 1
AZIN1 expression is increased in c-Myc amplified MB patients. MB fresh tissues from MYC amplified patients (n = 25) and MYC non amplified patients (n = 20) were stained for AZIN1; in A the immunofluorescence signal was detected by confocal microscopy and in B Immunohistochemical staining was performed, and images were taken on the ECHO Rebel-18 Microscope at 4X objective. C The levels of c-Myc and AZIN1 were measured by Western Blotting (WB) in MB cell lines for indicated antibodies and GAPDH was used as loading control. Bars represent the mean (±S.D.) from three independent experiments. Significant difference to corresponding proteins in D283 * (p < 0.05), **(p < 0.01). D H&E staining from a representative mouse brain resembling MYC amplified MB mouse model (n=3). E Immunofluorescence of slides from brain of MYC amplified MB mouse model (n=3) and sham mice brains (n = 4) were used as controls. Sham mice underwent intracranial injection, but instead of cells, sterile PBS were injected. Bars represent the mean (±S.D.) from three independent experiments. ** Significant difference to sham (p < 0.01). F Using publicly available dataset of 223 MB patients [43] and analyzing the correlation between AZIN1 and MYC mRNA expressions (p- value 4.88 e-09). G The AZIN1 copy numbers were measured by Copy Number Variation assay in non MYC amplified D283 and MYC amplified D458 and D556 cells. H Using publicly available Cancer Cell Line Encyclopedia (CCLE) database, the correlation between MYC and AZIN1 copy numbers in 996 cell lines were analyzed (R = 0.7, p-value = 1.90207e-150). (I-L) Data from a publicly available dataset [40] were analyzed for correlation between AZIN1 and MYC mRNA expressions in; group 3 (p=1.30e-13) I, group 4 (p=0.271) J, SHH (p=0.588) K and WNT (p=0.393) L MB subgroups. M Single-Cell RNA Sequencing data [36] from group 3, group 4, SHH and WNT MB subgroups were sorted based on MYC expression status individually and a comparison was performed for each subgroup (Supplementary Table 1A and B). AZIN1 expression was compared between MYC positive cells verses MYC negative cells, among each individual MB subgroup. N AZIN1expression in MYC positive cells were compared between MB subgroups using Single-Cell RNA Sequencing data [36] (Supplementary Table C)
Fig. 1
Fig. 1
AZIN1 expression is increased in c-Myc amplified MB patients. MB fresh tissues from MYC amplified patients (n = 25) and MYC non amplified patients (n = 20) were stained for AZIN1; in A the immunofluorescence signal was detected by confocal microscopy and in B Immunohistochemical staining was performed, and images were taken on the ECHO Rebel-18 Microscope at 4X objective. C The levels of c-Myc and AZIN1 were measured by Western Blotting (WB) in MB cell lines for indicated antibodies and GAPDH was used as loading control. Bars represent the mean (±S.D.) from three independent experiments. Significant difference to corresponding proteins in D283 * (p < 0.05), **(p < 0.01). D H&E staining from a representative mouse brain resembling MYC amplified MB mouse model (n=3). E Immunofluorescence of slides from brain of MYC amplified MB mouse model (n=3) and sham mice brains (n = 4) were used as controls. Sham mice underwent intracranial injection, but instead of cells, sterile PBS were injected. Bars represent the mean (±S.D.) from three independent experiments. ** Significant difference to sham (p < 0.01). F Using publicly available dataset of 223 MB patients [43] and analyzing the correlation between AZIN1 and MYC mRNA expressions (p- value 4.88 e-09). G The AZIN1 copy numbers were measured by Copy Number Variation assay in non MYC amplified D283 and MYC amplified D458 and D556 cells. H Using publicly available Cancer Cell Line Encyclopedia (CCLE) database, the correlation between MYC and AZIN1 copy numbers in 996 cell lines were analyzed (R = 0.7, p-value = 1.90207e-150). (I-L) Data from a publicly available dataset [40] were analyzed for correlation between AZIN1 and MYC mRNA expressions in; group 3 (p=1.30e-13) I, group 4 (p=0.271) J, SHH (p=0.588) K and WNT (p=0.393) L MB subgroups. M Single-Cell RNA Sequencing data [36] from group 3, group 4, SHH and WNT MB subgroups were sorted based on MYC expression status individually and a comparison was performed for each subgroup (Supplementary Table 1A and B). AZIN1 expression was compared between MYC positive cells verses MYC negative cells, among each individual MB subgroup. N AZIN1expression in MYC positive cells were compared between MB subgroups using Single-Cell RNA Sequencing data [36] (Supplementary Table C)
Fig. 2
Fig. 2
AZIN1 overexpression or transfer by EVs causes a significantly increased MB cell invasion and proliferation. A D283, D458 and D556 cells (as indicated in the figure) were transfected with plasmids expressing pCDNA3.1 (Empty) and pCDNA3.1 AZIN1, and the transfection efficiency was measured by WB, using AZIN1 antibody. GAPDH was used as a loading control. The effect of overexpressing AZIN1 plasmid on the behavior of D283, D458 and D556 cells with regard to B-D invasion into extracellular matrix, E-G cell proliferation, or H-J colony formation in soft agar. A-J MB cells (as indicated in the figure) were transfected with plasmids expressing pCDNA3.1 (Empty) and pCDNA3.1 AZIN1. Proliferation was measured by MTT assay. Invasion was through Matrigel supported by transwells (8 μm pores) followed by methanol fixation and toluene blue staining. Soft agar colony formation assays were performed for 19-21 days, fixed, and crystal violet stained. K Normal human fetal glial SVG, D283, D458 and D556 cells were cultured for 24h and serum starved for additional 24h, extracellular AZIN1 in the cell medium was detected by WB and Actin was used as a loading control. L-N pCDNA3.1-Clover-AZIN1 plasmid was transfected in D283 L, D458 M and D556 N cells and analyzed by confocal microscopy, 3D images are shown. O WB analysis confirming that AZIN1 is secreted by MB cells via small EVs (AZIN1-EVs). Apoptotic bodies, large EVs, and small EVs were isolated and analyzed by WB for indicated proteins. P TEM images of AZIN1-EVs isolated from D556 cells. Q AZIN1-EVs transfer AZIN1 to the AZIN1KO D556 cells as confirmed by WB analysis. R AZIN1KO D556 cells treated with AZIN1-EVs exhibit an increase invasiveness in vitro compared to small EVs derived from D556 cells KO for AZIN1 (AZIN1KO-EVs). In B-R, bars represent the mean (±S.D.) from three independent experiments. * Significant difference to indicated controls (P < 0.05), ** (P< 0.01), *** (P< 0.001), **** (P< 0.0001)
Fig. 3
Fig. 3
AZIN1 CRISPR KO decreases tumor growth and prolongs survival in vivo. Using CRISPR/Cas9 gene editing and specific sgRNAs, AZIN1 protein expression was successfully knocked out in D556 cells; A Cell growths were monitored by microscopy, images taken by the ECHO Rebel-18 Microscope at 4X objective after 72 hours. B Cell proliferation was measured by MTT assay. C GFP-Luciferase expressing D556 WT or AZIN1 KO cells were injected intracranially into nude mice and tumor growth were measured by AVIS Spectrum in vivo imaging system. In D the survival of the mice is presented in a Kaplan-Meier curve. C and D WT and KO (n=8/group; 4 females and 4 males), sham (n=3, male mice) at 14 days post injection, 7/8 mice in both WT and KO groups showed visible tumors and were included in the study. E Images from mice brain sections, 14 days post-injection, stained with DAPI and excited by the 488 nm laser to detect GFP expressing cells, without the use of antibodies. F Schematic images of inner frontal part of mice skull after being injected intracranially with WT or AZIN1 KO D556 for 15 days. G 5µM sections from the inner frontal part were stained with DAPI and excited by the 488 nm laser to detect GFP expressing cells, without the use of antibodies. In B-G, bars represent the mean (±S.D.) from three independent experiments. * Significant difference to indicated controls (P < 0.05), ** (P< 0.01), *** (P< 0.001), **** (P< 0.0001)
Fig. 4
Fig. 4
Crosstalk between AZIN1 and c-Myc proteins in MYC amplified cells sustains exogenous polyamine access. A-E The levels of c-Myc and AZIN1 were measured by WB in MB cell lines for indicated antibodies and GAPDH was used as loading control. A Using CRISPR/Cas9 gene editing and specific sgRNAs, AZIN1 protein expression was successfully knocked out in D556 cells. Four single-cell derived colonies are shown, in which three with successful AZIN1 KO. B AZIN1 was stably transfected in D458, using an AZIN1 inducible vector. C D258, D D458 and E D556 cells were treated with shRNA Control, shRNA AZIN1 or shRNA c-Myc, after antibiotic selection, cells from passages 2-7 were analyzed. F The MYC specific binding motif (5′‐CACGTG‐3′) was identified in the AZIN1 gene; promoter, previously reported MYC binding site and gene body. G ChIP assay was performed on the indicated cell lines and the binding between c-Myc and the AZIN1 promotor was analyzed. H D283, I D458 and J D556 were treated with 30 μM of PolyamineRED for 10 min. After incubation, cells were washed three times by PBS, followed by formalin fixation (20 min) and DAPI staining. Using confocal microscopy, images were obtained at Ex/Em=560 nm/585 nm for TAMRA and at Ex/Em=358 nm/461 nm for DAPI. In A-E and G-J, bars represent the mean (±S.D.) from three independent experiments. ns stands for no significant difference to indicated controls. * Significant difference to indicated controls (P < 0.05), ** (P< 0.01), *** (P< 0.001), **** (P< 0.0001)
Fig. 4
Fig. 4
Crosstalk between AZIN1 and c-Myc proteins in MYC amplified cells sustains exogenous polyamine access. A-E The levels of c-Myc and AZIN1 were measured by WB in MB cell lines for indicated antibodies and GAPDH was used as loading control. A Using CRISPR/Cas9 gene editing and specific sgRNAs, AZIN1 protein expression was successfully knocked out in D556 cells. Four single-cell derived colonies are shown, in which three with successful AZIN1 KO. B AZIN1 was stably transfected in D458, using an AZIN1 inducible vector. C D258, D D458 and E D556 cells were treated with shRNA Control, shRNA AZIN1 or shRNA c-Myc, after antibiotic selection, cells from passages 2-7 were analyzed. F The MYC specific binding motif (5′‐CACGTG‐3′) was identified in the AZIN1 gene; promoter, previously reported MYC binding site and gene body. G ChIP assay was performed on the indicated cell lines and the binding between c-Myc and the AZIN1 promotor was analyzed. H D283, I D458 and J D556 were treated with 30 μM of PolyamineRED for 10 min. After incubation, cells were washed three times by PBS, followed by formalin fixation (20 min) and DAPI staining. Using confocal microscopy, images were obtained at Ex/Em=560 nm/585 nm for TAMRA and at Ex/Em=358 nm/461 nm for DAPI. In A-E and G-J, bars represent the mean (±S.D.) from three independent experiments. ns stands for no significant difference to indicated controls. * Significant difference to indicated controls (P < 0.05), ** (P< 0.01), *** (P< 0.001), **** (P< 0.0001)
Fig. 5
Fig. 5
AZIN1 is expressed in the CSF and urine of MB patients. A CSF AZIN1 levels were quantified by WB and compared between children with MB (n = 11) and age matched fatty filum controls (n = 8). B Pre- and postoperative urinary AZIN1 levels from one patient, with corresponding MRI C at times of urine collection (pre-op and 8 weeks post-op), tumor marked with a red line. Urinary AZIN1 levels were quantified by WB, 30 or 100µg of protein were loaded. In A, bars represent the mean (±S.D.) from three independent experiments. Significant difference to indicated controls **** (P< 0.0001)
Fig. 6
Fig. 6
The role of AZIN1 in the regulation of the MB phenotype. A, in MYC non amplified MB, targeting AZIN1 leads to inhibition of the tumor suppressor Antizyme facilitates the degradation of several growth promoters, including ODC and also blocks the polyamine endocytoses. AZIN1 also regulates c-Myc through ODC. B, in MYC amplified MB, targeting AZIN1 leads to increased c-Myc levels. In a positive-feedback loop, c-Myc amplification sustains active polyamine endocytoses, leading to an increase c-Myc gene expression. In A and B, as c-Myc binds to the promotor region of AZIN1, inhibiting c-Myc leads to decrease of AZIN1

References

    1. Fric R, Due-Tonnessen BJ, Lundar T, Egge A, Kronen Krossnes B, Due-Tonnessen P, Stensvold E, Brandal P. Long-term outcome of posterior fossa medulloblastoma in patients surviving more than 20 years following primary treatment in childhood. Sci Rep. 2020;10(1):9371. - PMC - PubMed
    1. Cho YJ, Tsherniak A, Tamayo P, Santagata S, Ligon A, Greulich H, Berhoukim R, Amani V, Goumnerova L, Eberhart CG, et al. Integrative genomic analysis of medulloblastoma identifies a molecular subgroup that drives poor clinical outcome. J Clin Oncol. 2011;29(11):1424–30. - PMC - PubMed
    1. Hill RM, Kuijper S, Lindsey JC, Petrie K, Schwalbe EC, Barker K, Boult JK, Williamson D, Ahmad Z, Hallsworth A, et al. Combined MYC and P53 defects emerge at medulloblastoma relapse and define rapidly progressive, therapeutically targetable disease. Cancer Cell. 2015;27(1):72–84. - PMC - PubMed
    1. Kawauchi D, Robinson G, Uziel T, Gibson P, Rehg J, Gao C, Finkelstein D, Qu C, Pounds S, Ellison DW, et al. A mouse model of the most aggressive subgroup of human medulloblastoma. Cancer Cell. 2012;21(2):168–80. - PMC - PubMed
    1. Juraschka K, Taylor MD. Medulloblastoma in the age of molecular subgroups: a review. J Neurosurg Pediatr. 2019;24(4):353–63. - PubMed

MeSH terms

LinkOut - more resources