. 2025 Feb 12:20:1921-1948.
doi: 10.2147/IJN.S499161. eCollection 2025.

Biodegradable Electrospun PLGA Nanofibers-Encapsulated Trichinella Spiralis Antigens Protect from Relapsing Experimental Autoimmune Encephalomyelitis and Related Gut Microbiota Dysbiosis

Affiliations

Biodegradable Electrospun PLGA Nanofibers-Encapsulated Trichinella Spiralis Antigens Protect from Relapsing Experimental Autoimmune Encephalomyelitis and Related Gut Microbiota Dysbiosis

Ljiljana Sabljić et al. Int J Nanomedicine. .

Abstract

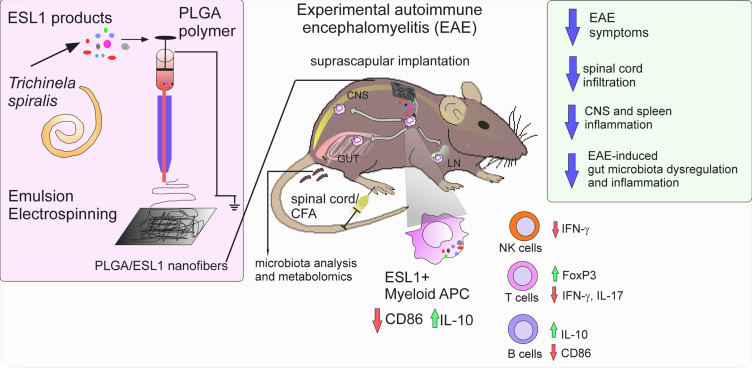
Purpose: Trichinella spiralis has evolved complex immunomodulatory mechanisms mediated by excretory-secretory products (ESL1) that enable its survival in the host. Consequently, ESL1 antigens display excellent potential for treating autoimmune diseases such as multiple sclerosis (MS). However, whether timely controlled delivery of ESL1 antigens in vivo, as in natural infections, could enhance its therapeutic potential for MS is still unknown.

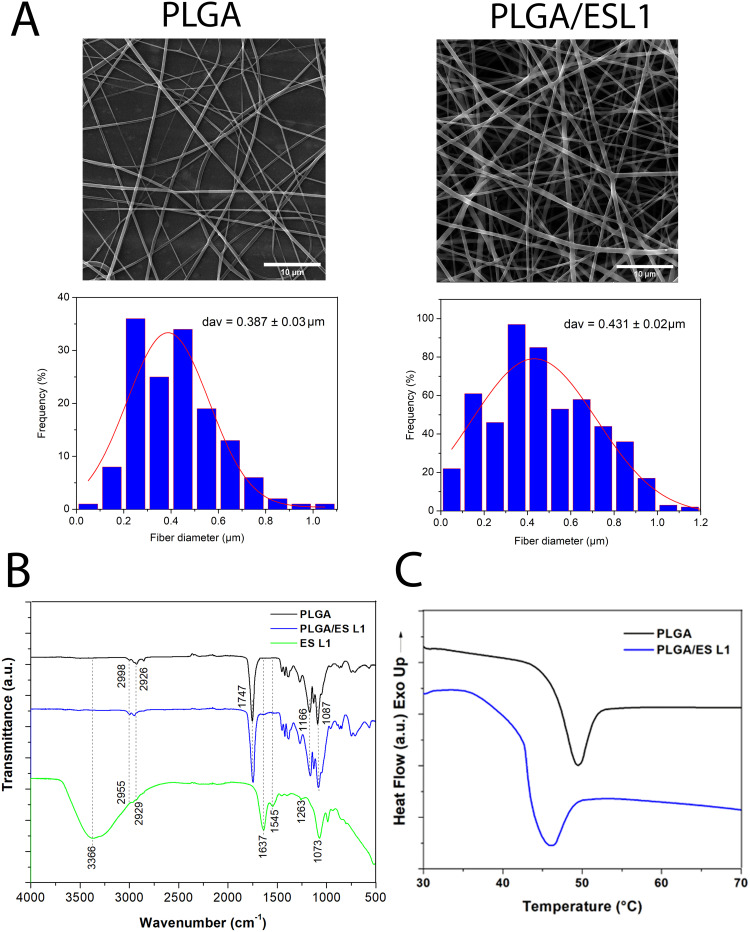
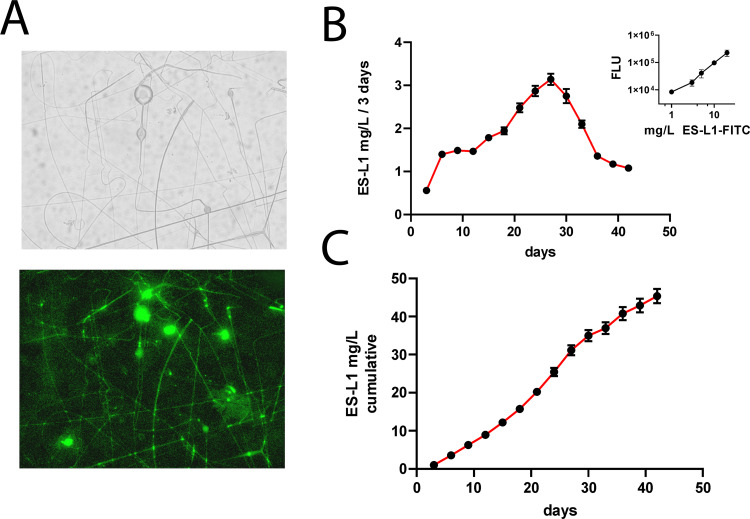
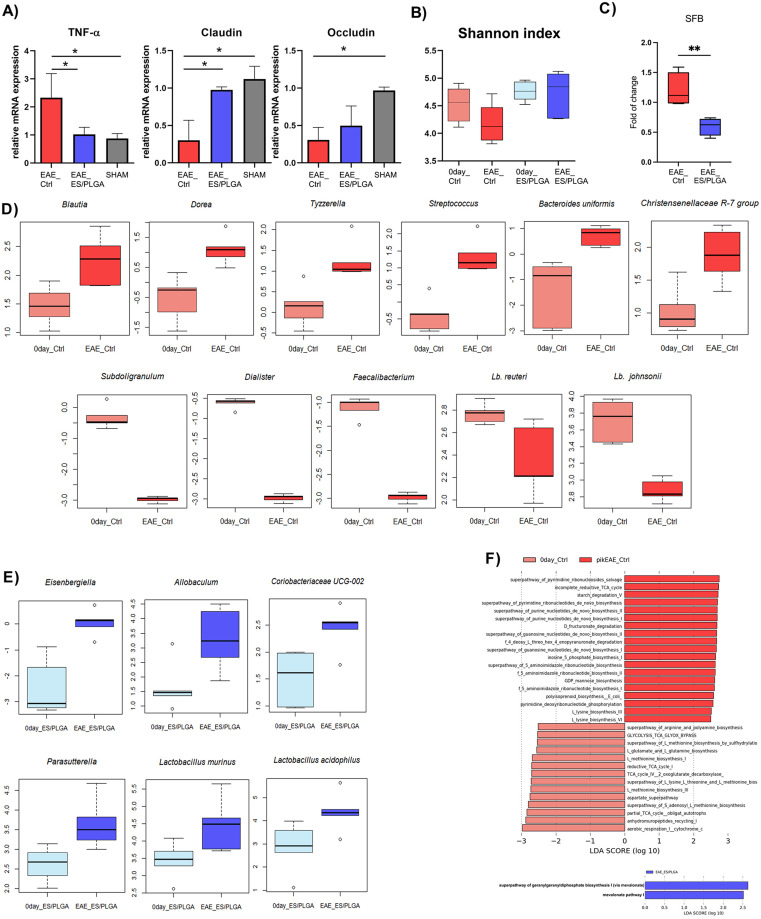
Methods: To test this, we encapsulated ESL1 antigens into biodegradable poly (lactide-co-glycolic) acid (PLGA) nanofibers by emulsion electrospinning as a delivery system and assessed their release dynamics in vitro, and in an animal MS model, experimental autoimmune encephalomyelitis (EAE), induced 7 days after PLGA/ESL1 subcutaneous implantation. PLGA/ESL1 effects on EAE symptoms were monitored along with multiple immune cell subsets in target organs at the peak and recovery of EAE. Gut barrier function and microbiota composition were analyzed using qPCR, 16S rRNA sequencing, and metabolomic analyses.

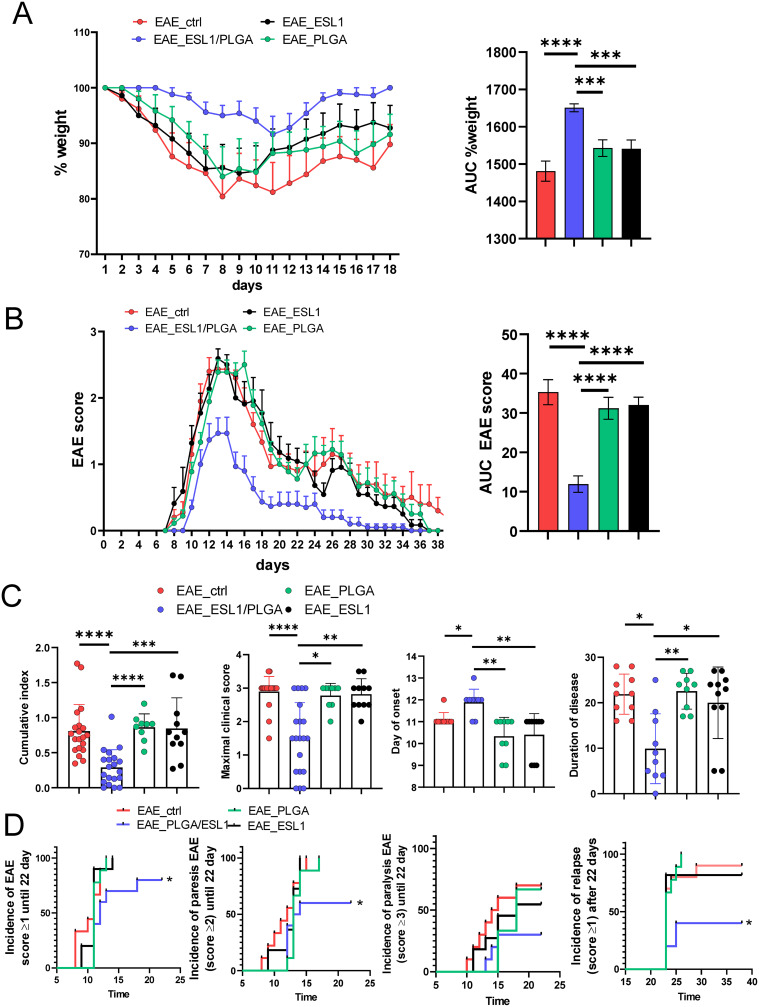
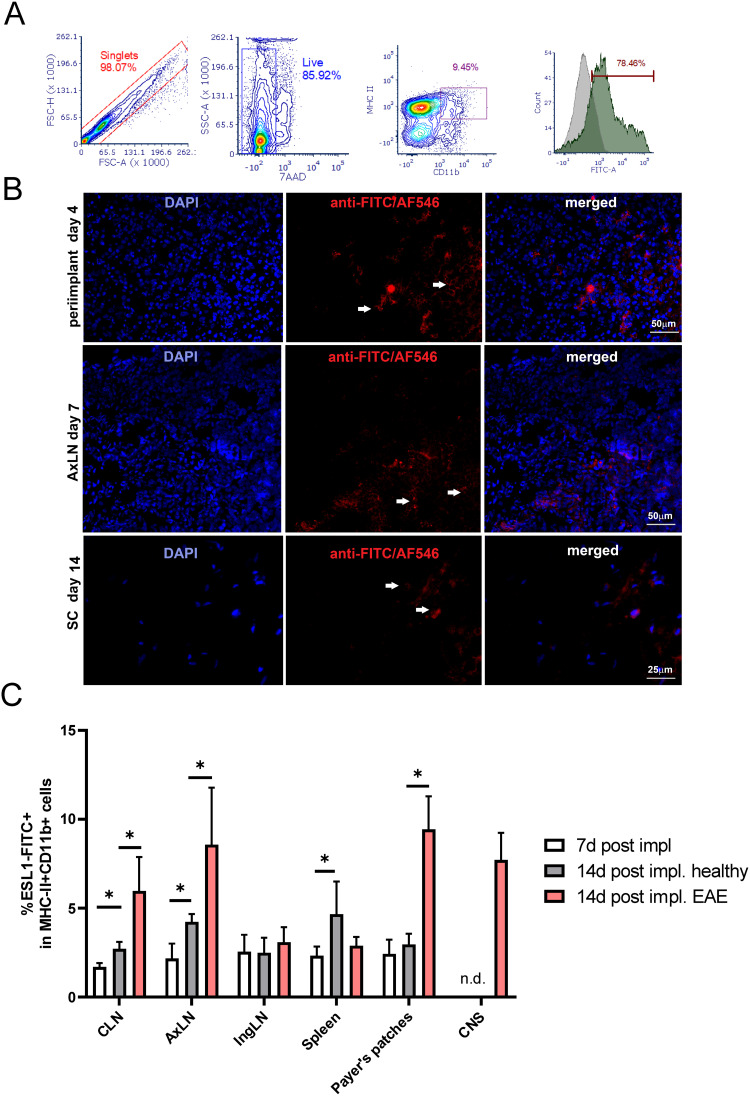
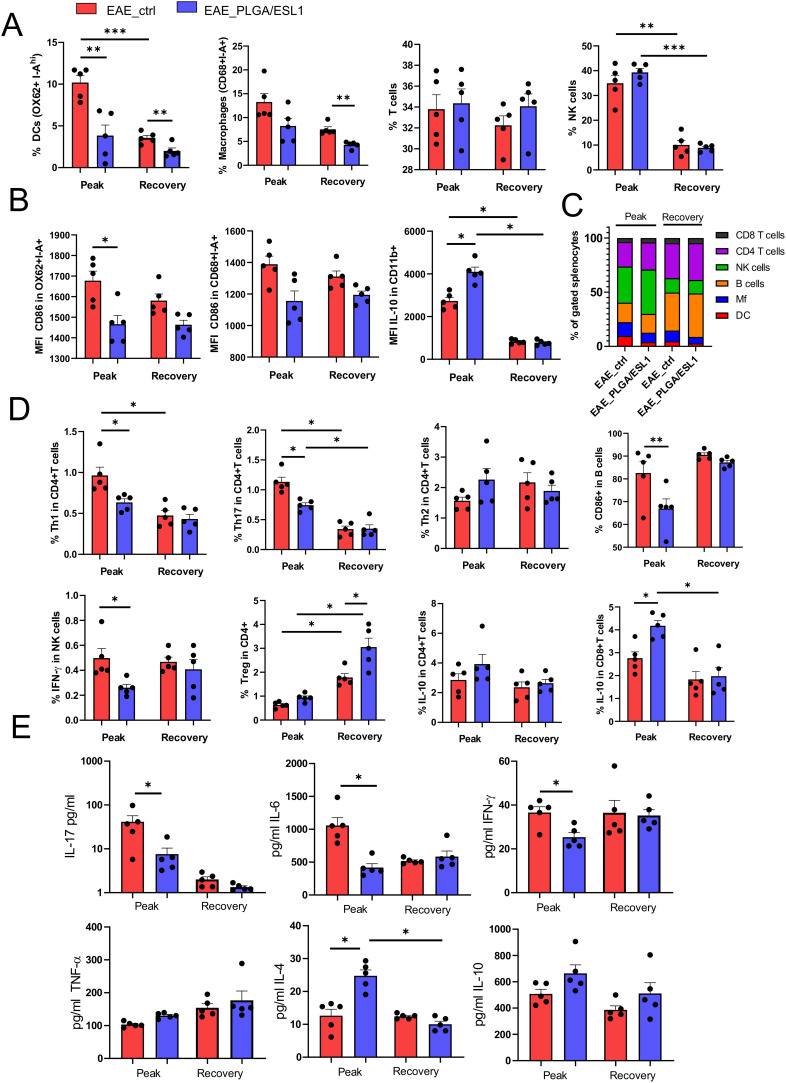
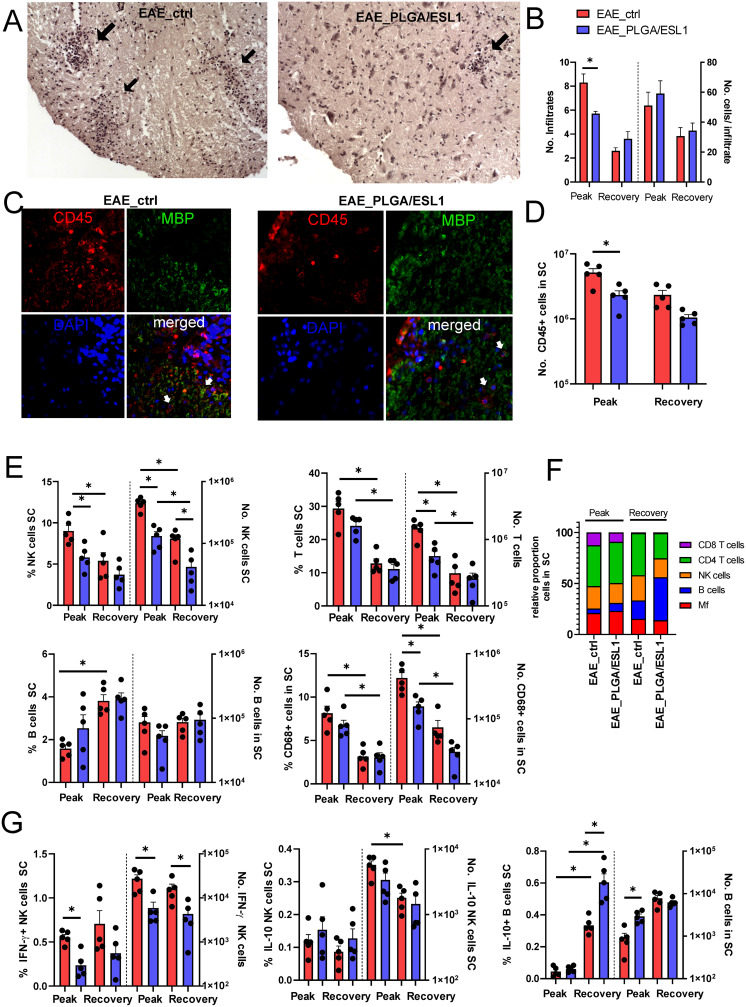
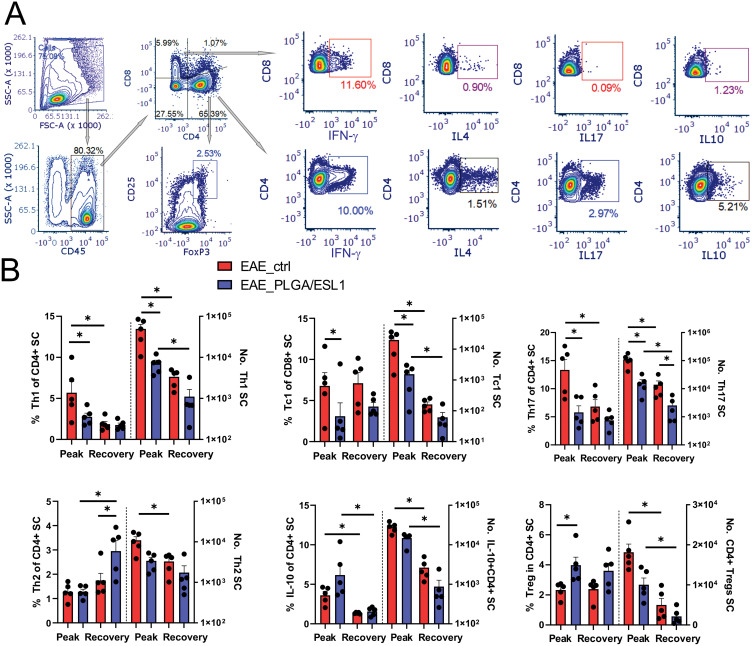
Results: ESL1 antigens, released from PLGA and drained via myeloid antigen-presenting cells through lymph nodes, protected the animals from developing EAE symptoms. These effects correlated with reduced activation of myeloid cells, increased IL-10 expression, and reduced accumulation of proinflammatory natural killer (NK) cells, T helper (Th)1 and Th17 cells in the spleen and central nervous system (CNS). Additionally, CD4+CD25hiFoxP3+ regulatory T cells and IL-10-producing B cells were expanded in PLGA/ESL1-treated animals, compared to control animals. The migration of ESL1 to the guts correlated with locally reduced inflammation and gut barrier damage. Additionally, PLGA/ESL1-treated animals displayed an unaltered microbiota characterized only by a more pronounced protective mevalonate pathway and expanded short-chain fatty acid-producing bacteria, which are known to suppress inflammation.

Conclusion: The delivery of T. spiralis ESL1 antigens via biodegradable electrospun PLGA nanofiber implants efficiently protected the animals from developing EAE by inducing a beneficial immune response in the spleen, gut, and CNS. This platform provides excellent grounds for further development of novel MS therapies.

Keywords: PLGA nanofibers; drug delivery; electrospinning; gut microbiota; immune modulation; tolerogenic cells.


Conflict of interest statement

The authors report no conflicts of interest in this work.

Figures

None
Graphical abstract
Figure 1
Figure 1
Characteristics of PLGA/ESL1 nanofibers and release dynamics of ESL1. (A) Representative FEI-SEM images of PLGA/ESL1 and PBS/PLGA nanofibers are shown, which were used for the measurements of fibre diameter (upper row). The frequency distribution of nanofiber diameters is shown with the fitting curve (lower row). (B) FTIR spectra of PLGA/ESL1 and PLGA are shown with peak transmittance indicated for relevant bonds. (C) DSC analysis of PLGA/ESL1 and PLGA are shown.
Figure 2
Figure 2
Release dynamics of ESL1 from PLGA in vitro. (A) Representative phase-contrast (upper) and fluorescence (lower) images of PLGA loaded with ESL1-FITC (40x magnification) are shown. (B) Release dynamics of ESL1-FITC (50 µg) from PLGA (1 cm2) incubated in 50% wound exudate in PBS over 44 days. Each dot represents the mean amount ± SD (from triplicates of one out of four independent experiments) of ESL1 collected every 3 days during the incubation. The amount of ESL1 was calculated from the standard curve (inset in the upper right corner). (C) A cumulative release of ESL1-FITC over 44 days is shown as mean ± SD (n=3).
Figure 3
Figure 3
Effects of PLGA/ESL1 implants on EAE symptoms. The soluble ESL1 (350 µg/dose), or implants of PLGA/ESL1 (containing 350 µg ESL1 / 7 cm2 PLGA) or control PBS/PLGA (7 cm2), were applied subcutaneously in the suprascapular region of DA rats. Seven days after the implantation, the rats were immunised to develop EAE, as described. (A) The weight of each animal was monitored for 18 days, and the data is shown as mean weight % ± SE (N (EAE_PLGA, EAE_ESL1) = 10; N (EAE_PLGA/ESL1, EAE_ctrl) = 20), from two or four independent experiments, respectively. The area under the curve (AUC) for weight %, calculated for each animal, is shown as mean ± SEM. (B) EAE scores over 38 days of monitoring are shown as mean ± SEM (N= as in (A)), and AUC of EAE scores for each animal is presented as mean ± SEM. (C) Cumulative index, maximal clinical score, day of disease onset and duration of the disease are shown as mean ± SEM (N= as in (A), or 10 for duration of disease) and each animal is presented by a dot. (A-C) *p<0.05, **p<0.01, ***p<0.005, ****p<0.001, as indicated (Kruskal–Wallis test with Dunn’s multiple comparison test). (D) Incidence of EAE symptoms (limp tail ≥1, paresis ≥2, paralysis ≥3) in each group during the first 22 days is presented as the log-rank curve. Likewise, the incidence of relapse (score ≥1 after day 22) is shown. *p<0.05 Long-Rank (Mantel-Cox) test vs EAE_ctrl group.
Figure 4
Figure 4
Tracking of ESL1-FITC released from PLGA in vivo. (A) ESL1 was labelled with FITC and used in 24h- cultures with rat splenocytes at 50 µg/mL. The live (7AAD-) cells were analysed for CD11b-APC and I-A-PE expression and the Q2 region (CD11b+I-A+) showed the highest fluorescence of ESL1-FITC. Ctrl represents the signal from CD11b/I-A-stained cells not treated with ESL1-FITC. (B) Epi-fluorescent microscopy analyses are shown of the peri-implant region collected 4 days after the implantation of PLGA/ESL1-FITC (upper row); axillary lymph nodes collected 7 days (middle row) after the implantation; the spinal cords collected on 14 days after the implantation and 7 days after EAE induction (lower row). To avoid bleaching and increase ESL1-FITC detection, ESL1-FITC was detected with anti-FITC/Alexa Fluor (AF) 546 mAb, and the nuclei were stained with DAPI (see Supplementary Figure S1). White arrows point to nucleated cells positive for ESL1. (C) The percentage of ESL1-FTIC+ myeloid (CD11b+I-A+) cells from cervical, axillary, inguinal lymph nodes, spleen, Payer’s patches and spinal cord (CNS) were analysed 7 days after the implantation of ESL1-FITC/PLGA, or 14 days after the implantation in immunised (EAE) or non-immunized (healthy) animals, as described. Non-specific fluorescence was determined by using FMO-controls and PLGA/ESL1-treated animals, and the data is shown as mean ± SEM (n=4 animals per each group) (see Supplementary Figure S2 for a representative analysis) from one out of three independent experiments. n.d.-not determined/detected *p<0.05, as indicated (Kruskal–Wallis test with Dunn’s multiple comparison test).
Figure 5
Figure 5
Effects of PLGA/ESL1 on immune response in spleen during EAE. Seven days before immunisation with spinal cord homogenate in CFA, DA rats were implanted with PLGA/ESL1 (350µg ESL1 / 7 cm2 PLGA) subcutaneously in the suprascapular region (EAE_PLGA/ESL1) or just sham-operated (EAE_ctrl). Splenocytes collected from animals at the peak of EAE (day 14), or in the recovery phase (day 20) were collected and analysed by flow cytometry, as described in Supplementary Figure S3. (A) The proportion of DCs (OX62+I-Ahi), macrophages (CD68+I-A+), T (CD3+CD161) and NK cells (CD3CD161+) cells is shown. (B) The expression of CD86 within DCs and macrophages, and IL-10 expression within total myeloid (CD11b+) cells are shown as mean fluorescence intensity (MFI). (C) The relative proportion of cell types is shown after the normalisation of the gated cells to 100%. See Supplementary Figure S4A for data on the proportion of B cells, CD4+ and CD8+ T cells. (D) The proportion of Th1 (IFN-γ+), Th17 (IL-17+), Th2 (IL-4+) cells within CD4+ T cells subsets, and IFN-γ producing NK cells are shown, as well as CD25hiFoxP3+ Tregs and IL-10-producing T cells. All T cell subsets in the spleen were gated as demonstrated in Figure 7A and 7E) The level of cytokines spontaneously produced by the splenocytes (2 x 10⁶/ mL) in 48h-cultures upon the isolation from EAE_PLGA/ESL1 or EAE_ctrl animals at the EAE peak or recovery from one, out of two experiments is shown. (A, B, D, E) *p<0.05, **p<0.001, ***p<0.005, as indicated (Kruskal–Wallis test with Dunn’s multiple comparison test).
Figure 6
Figure 6
Effects of PLGA/ESL1 on the infiltration of leukocytes to the spinal cord. Seven days before the immunisation, animals were implanted with either PLGA/ESL1 or sham-operated, as described. (A) Representative images at 10x obj. mag. are shown of HE-stained spinal cord (lumbar part) cross-sections from EAE_ctrl and EAE_PLGA/ESL1 animals at the peak of EAE, with indicated immune infiltrates (black arrows). (B) The average number of infiltrates and the number of cells/infiltrates were counted from HE-stained slides as described in Materials and Methods. (C) Representative images at 20x obj. mag. are shown after staining the cross-sections (as in (A) with anti-CD45-Alexa Fluor 546 (red) and anti-MBP-Alexa Fluor 488 (green), while nuclei were stained with DAPI. (D) The total number of CD45+ cells in spinal cord infiltrates is shown, as determined according to the Muse Cell Count viability kit, and CD45 staining by flow cytometry. (E) The proportion and the absolute number of NK, T, B cells and macrophages in the spinal cord infiltrates from the EAE peak or recovery are shown. (F) The summarised data indicating the relative proportions of these cells normalised to all gated leukocytes (100%) is shown. (G) The proportions and the number of IFN-γ+ or IL-10+ NK (CD161+CD3) cells are shown, as well as IL-10+ B cells in the total cells isolated from SC at the EAE peak and recovery from a representative experiment out of two. (B, D, E, G) *p<0.05 as indicated (Kruskal–Wallis test with Dunn’s multiple comparison test).
Figure 7
Figure 7
Effects of PLGA/ESL1 on the T cell profile in the spinal cord infiltrates. Seven days before the immunisation, animals were implanted with either PLGA/ESL1 or sham-operated, as described, and then isolated from CNS and activated with PMA (20ng/mL) /Ca Ionophore (500ng/mL) and Monensin 3 µM for 4h before staining for flow cytometry. (A) The gating strategy for identification of CD8+T cell subsets producing IFN-γ (Tc1), IL-4 (Tc4), IL-17 (Tc17) and IL-10 (IL-10+ CD8+ T cells) and equivalent subsets of CD4+ Th cells are shown. CD4+ T cells were gated to CD25hi FoxP3+ to identify Tregs. (B) The summarised data from a representative experiment out of two, on the relative proportion and the total number of T cell subsets are shown. See Supplementary Figure S5, for data on total CD4+, CD8+ T cells and IL-10-producing CD8+T cells. *p<0.05 as indicated (Kruskal–Wallis test with Dunn’s multiple comparison test).
Figure 8
Figure 8
Effects of PLGA/ESL1 on gut inflammation and microbiota features. (A) Relative mRNA expression of TNF-α, Claudin and Occludin was determined in gut samples collected from EAE_ctrl, EAE_PLGA/ESL1, and sham-operated animals at the peak of the disease from a representative experiment out of two are shown. *p<0.05 as indicated (one-way ANOVA with Tukey’s multiple comparisons test). The faecal material was collected right before the EAE induction in control (0day_Ctrl) and PLGA/ESL1-treated animals (0day_PLGA/ESL1) and at the peak of disease (EAE_Ctrl, EAE_PLGA/ESL1). DNA was isolated, and 16s rRNA sequencing (B, D, E and F) or qPCR (C) was performed. (B) The changes in the Shannon index between 0day and peak of the disease in the control (red) and PLGA/ESL1-treated (blue) groups are shown by boxplots. (C) The fold changes in SFB-specific sequence expression were calculated by dividing the values measured at the peak of the disease and the values at 0day for each animal. Control (red) and PLGA/ESL1- treated (blue) groups were compared by Student T test (**p<0.01). The changes in the relative abundances of Taxa (ANCOM W > 1, Pairwise Wilcoxon test or paired t-test followed by Benjamini-Hochberg p-value correction) at the EAE peak compared to 0day in (D) control group of animals, (E) PLGA/ESL1- treated group. (F) The most differentially abundant predictive metabolic pathways of gut microbiota at 0day compared to the EAE peak in control (red) and PLGA/ESL1- treated (blue) groups analysed by Linear discriminant analysis (LDA) effect size (LEfSe) (LDA score above 2.5, alpha value of <0.05 for factorial Kruskal–Wallis). Pathways with positive LDA scores (darker bars) are more prominent at the EAE peak of the disease, whereas negative LDA scores (brighter bars) indicate pathways enriched at 0day, in both groups (control (red) and PLGA/ESL1- treated (blue)).

Similar articles

References

    1. Compston A, Coles A. Multiple sclerosis. Lancet. 2008;372(9648):1502–1517. doi:10.1016/S0140-6736(08)61620-7 - DOI - PubMed
    1. Lanz TV, Brewer RC, Ho PP, et al. Clonally expanded B cells in multiple sclerosis bind EBV EBNA1 and GlialCAM. Nature. 2022;603:7900):321–327. doi:10.1038/s41586-022-04432-7 - DOI - PMC - PubMed
    1. Bar-Or A, Li R. Cellular immunology of relapsing multiple sclerosis: interactions, checks, and balances. Lancet Neurol. 2021;20(6):470–483. doi:10.1016/S1474-4422(21)00063-6 - DOI - PubMed
    1. Vargas DL, Tyor WR. Update on disease-modifying therapies for multiple sclerosis. J Investig Med. 2017;65(5):883–891. doi:10.1136/jim-2016-000339 - DOI - PubMed
    1. Amorim A, De Feo D, Friebel E, et al. IFNγ and GM-CSF control complementary differentiation programs in the monocyte-to-phagocyte transition during neuroinflammation. Nat Immunol. 2022;23(2):217–228. doi:10.1038/s41590-021-01117-7 - DOI - PubMed

MeSH terms

Substances

LinkOut - more resources