. 2025 Feb 3:15:1336882.
doi: 10.3389/fimmu.2024.1336882. eCollection 2024.

Hypoxia-driven mobilization of altruistic cancer stem cells in platinum-treated head and neck cancer

Affiliations

Hypoxia-driven mobilization of altruistic cancer stem cells in platinum-treated head and neck cancer

Lekhika Pathak et al. Front Immunol. .

Abstract

Background: Head and neck cancers harbor dormant cancer stem cells (CSCs). This study explores how platinum therapy impacts these cells in a non-genetic manner and the role of hypoxia in this process. Previously, we identified a novel population of CSCs exhibiting an "altruistic" phenotype, sacrificing self-renewal to promote niche defense (tumor stemness defense, TSD), potentially protecting a dormant subpopulation of CSCs, the reawakening CSC (R-CSC) retaining stress memory. This TSD phenotype involves the activation of the MYC-HIF2α pathway and, importantly, is linked to a hypoxic tumor microenvironment. We termed these TSD+ CSCs "altruistic cancer stem cells" (A-CSCs). Here we investigated the potential role of tumor hypoxia in the mobilization of TSD+ CSCs to the circulation as a part of niche defense against platinum therapy.

Methods: We isolated CTCs and primary tumor cells from head and neck squamous cell carcinoma (HNSCC) patients undergoing platinum therapy (n = 14). We analyzed the TSD phenotype and markers of hypoxia in these cells. Additionally, we further characterized a previously reported pre-clinical model of platinum-induced tumor stemness to study the link between hypoxia, TSD+ CSC emergence, and mobilization to the circulation and bone marrow.

Results: We isolated TSD+ CTCs with a hypoxic signature from eight out of 14 HNSCC patients. These cells displayed increased proliferation and invasion upon cisplatin treatment, suggesting a role in niche defense. Our pre-clinical model confirmed that hypoxia directly correlates with the expansion of TSD+ CSCs and their mobilization into the circulation and bone marrow following cisplatin treatment. We demonstrated the protection of R-CSCs by TSD+ CSCs. Notably, inhibiting hypoxia alone with tirapazamine did not reduce TSD+ CSCs, CTCs, or R-CSCs. However, combining tirapazamine with FM19G11, a MYC-HIF2α pathway inhibitor, significantly reduced the platinum-induced expansion of both TSD+ CSCs, CTCs, and the presence of R-CSCs in the bone marrow.

Conclusions: This study reveals that HNSCC patients undergoing platinum therapy can harbor TSD+ CTCs exhibiting an altruistic phenotype and a hypoxic signature. Additionally, the pre-clinical study provides a novel non-genetic mechanism of therapy resistance-the altruistic tumor self-defense. The tumor microenvironment, through the emergence of TSD+ CSCs, appears to act collectively to defend the tumor self-identity by hijacking an altruistic stem cell niche defense mechanism.

Keywords: altruistic stem cells (ASCs); cancer stem cells (CSCs); circulating tumor cells; head and neck squamous cell carcinoma (HNSCC); platinum chemotherapy; reawakening CSCs (R-CSCs); tumor hypoxia; tumor stemness defense (TSD).


Conflict of interest statement

The authors declare that the research was conducted in the absence of any commercial or financial relationships that could be construed as a potential conflict of interest.

Figures
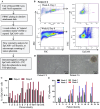
Figure 1
Figure 1
Isolation and expansion of circulating EpCAM+ cells from HNSCC patients. (A) Schematic workflow depicts the process of isolating and expanding EpCAM+ spheroids from PBMCs collected during cisplatin chemotherapy. (B) Representative flow cytometry plots illustrate the strategy for identifying EpCAM+ cells within PBMCs at baseline (Day 2) and after culture with a special media; injured conditioned media (ICM) (15). (C) Flow cytometry analysis was used to quantify the percentage of EpCAM+ cells within PBMCs following in vitro culture with ICM. (D) Phase-contrast microscopy images show PBMC cultures at Day 8 (Week 0): left image (patient #3) shows individual cells, while the right image (patient #6) highlights the formation of multicellular spheroids (arrows). (E) The number of spheroids formed from PBMCs grown in ICM for 8 days is quantified by manual counting. Week 0 corresponds to the day of chemotherapy administration, while Weeks 1-3 represent subsequent weeks.
Figure 2
Figure 2
Characterization of EpCAM+/ABCG2+ CTCs with TSD phenotype. (A) Flow cytometry analysis reveals the presence of EpCAM+/ABCG2+ cells within multicellular spheroids derived from patient peripheral blood mononuclear cells (PBMCs) after chemotherapy. (B) The percentage of EpCAM+/ABCG2+ cells within these spheroids was quantified for various patients (weeks after chemotherapy). (C) Phase-contrast microscopy image shows isolated EpCAM+/ABCG2+ cells from a patient sample (patient #6) for further analysis. Magnification 20X (D) EpCAM+/ABCG2+ cells displayed increased growth compared to EpCAM+/ABCG2- cells (patients 6, 8, 9, 10, 12) when grown under low-oxygen (2% O2) conditions in serum-free media. (E) Real-time PCR confirmed the expression of genes associated with the TSD phenotype in sorted EpCAM+/ABCG2+ cells from multiple patients (n=5, patients 6, 8, 9, 10, 12). (F) ELISA measured levels of TSD-related proteins in EpCAM+/ABCG2+ cells grown in serum-free media for two weeks (pooled from patients). No significant changes in protein levels were observed across cells isolated from different time points (weeks 0-3) after chemotherapy. (G) Boyden chamber assay assessed the invasive potential of EpCAM+/ABCG2+ cells with and without silencing of HIF-2α (a hypoxia-inducible factor) in cells from multiple patients (n=5, patients 6, 8, 9, 10, 12). (H) Immunofluorescence microscopy demonstrated pimonidazole staining (a marker of hypoxia) in EpCAM+/ABCG2+ cells from various patients (patients 6, 9, 10, 12). Data are presented as mean ± SEM. Statistical significance was determined using Student’s t-test (B, F, G), One way ANOVA (D, E). (*p<0.05, **p<0.01).
Figure 3
Figure 3
Identification of TSD+ EpCAM+/ABCG2+ cell Phenotype in Primary HNSCC. (A) Flow cytometry analysis demonstrates the presence of EpCAM+/ABCG2+ cells in a patient sample (patient #6, see Supplementary Table 1 ). (B) Purity of the immunomagnetically sorted ABCG2+ cells was assessed using flow cytometry. (C) Representative flow cytometry data shows pimonidazole (PIM, a hypoxia marker) staining in EpCAM+/ABCG2+ cells. (D, E) Quantification of data from panels (A, C) (percentage of EpCAM+/ABCG2+ cells and their PIM staining). The mean value of patient 2, 4 and 14 was used to compare the data. (F) Real-time PCR analysis revealed differential gene expression patterns associated with the TSD+ phenotype in sorted EpCAM+/ABCG2+ cells compared to EpCAM+/ABCG2- cells from patients 6, 10, and 12. (G) EpCAM+/ABCG2+ cells from specific patients (patients 6, 10, and 12) formed significantly more spheroids compared to cells from other patients (patients 2, 4, and 14).  (Student's t-test; **p < 0.01). (H) Hematoxylin and eosin (H&E) stained sections show a primary tumor (patient #10) and the corresponding xenograft derived from transplanted EpCAM+/ABCG2+ cells in NOD/SCID mice. (I) CSC frequency per 105 tumor cells as performed by in vivo limiting dilution assay. Data in panels (F–G) are presented as mean ± SEM. One Way Anova was used, with *p<0.05, **p<0.01, ***p<0.001 indicating statistical significance.
Figure 4
Figure 4
Identification of TSD phenotype in primary HNSCC: self-sufficiency and niche defense. (A) EpCAM+/ABCG2+ cells from patient #6 formed tumorospheres when grown under 2% oxygen in serum-free media for 8 days, while EpCAM+/ABCG2- and CD44+/ALDH+ cells from the same tumor did not. (B) Quantification of the number of tumorospheres formed by EpCAM+/ABCG2+ cells from different patient tumors. (C) The expansion of EpCAM+/ABCG2+ cells in the tumorospheres. The tumorospheres were dissociated and subjected to flow cytometry analysis to obtain the total number of EpCAM+/ABCG2+ cells. (D) EpCAM+/ABCG2+ cells isolated from the tumorospheres exhibit TSD+ gene expression pattern, similar to EpCAM+/ABCG2+ cells of CTC spheroids. (E)  EpCAM+/ABCG2+ cells obtained from tumorospheres were cultured in 2% oxygen+serum-free media (day 10) to measure the secretion of growth factors involved in self sufficiency of TSD+ phenotype. Conditioned media (CM) was collected from these cells to test altruistic niche defense behavior. (F) Schematic overview of the CSC niche defense experiment design. (G) Patient-derived EpCAM+/ABCG2+ cells were grown in injured conditioned media and then treated with cisplatin (10 uM for 48 hours). Cell survival was measured using trypan blue exclusion. (H) Real-time PCR analysis compared gene expression profiles of EpCAM+/ABCG2+ cells from patient #14 treated with cisplatin versus untreated cells (day 10). (I)  Quantification of Glutathione (GSH) in the EpCAM+/ABCG2+ cells obtained from day 10 culture shown in Figure 4G . The cells were grown in serum free media for 48 hours to measure GSH. Data in panels (B–E), and (G–I) are presented as mean ± SEM. Student's t-test was used in (C, G, I). One way ANOVA was used in (B, D, E, H),  with *p<0.05, **p<0.01, ***p<0.001 indicating statistical significance.
Figure 5
Figure 5
Preclinical model of cisplatin-Induced enrichment of TSD+ CSC and R-CSC. (A) Flow cytometry analysis reveals expansion of the side population (SP) fraction in SCC-25 cells following cisplatin treatment (10 μM, 4 days) under 2% oxygen in serum-free media, potentially enriching for R- CSCs. (B, C) Boyden chamber assay isolates migratory SP (SPm) cells. Cisplatin treatment increases SP, SPm, and EpCAM+/ABCG2+ cell populations compared to untreated controls. Intermittent hypoxia (hypoxia/re-oxygenation) serves as a positive control. (D) Schematic depicts the in vivo experiment design (based on Satavata Tarka) to generate R-CSCs and the TSD phenotype within EpCAM+/ABCG2+ cells. (E) Post-cisplatin EpCAM+/ABCG2+ cells form tumors with faster growth in NOD/SCID mice after additional cisplatin treatment (10 mg/kg, red arrow). 10,000 post-cisplatin EpCAM+/ABCG2+ cells were injected subcutaneously in mice. After one week, these mice received additional cisplatin treatment for two weeks. (F) Arrow shows tumorosphere obtained by culturing CD45- PBMCs of xenograft bearing mice. (G) The number of CTC spheroid increases in the cisplatin+ group as the tumor grow. For (C, E, G), data represent +/- SEM. One way ANOVA was used in (C). Student’s t-test was used in (E, G), *p<0.05, **p<0.01.
Figure 6
Figure 6
Cisplatin-induced CSC niche defense. (A) Limiting dilution assay (details in Supplementary Table 3 ) compares the self-renewal capacity of different cell types treated with cisplatin in vitro (cisplatin group), and in vivo (cisplatin +). (B) Images show tumors derived from EpCAM+/ABCG2+ cells at week 6. (C) Histograms show the corresponding SP and SPm fraction in the respective tumors shown in (B). (D–F) Analysis of SP and SPm fractions from tumors identifies a population with high ABCG2 and pimonidazole (hypoxia) markers, mostly EpCAM+/ABCG2+. SPm fraction has a significantly higher percentage of ABCG2+/Pimonidazole+ cells compared to SPn. (G, H) The "cisplatin +" group shows increased ABCG2+ and EpCAM+ cells within the SPm fraction. (I) Flow cytometry analysis revealed a correlation between tumor hypoxia (pimonidazole-positive cells) and the expansion of EpCAM+ABCG2+ cells. Black denotes pimonidazole and Red denotes EpCAM+/ABCG2+ cells. (J) Real-time PCR reveals upregulation of TSD genes in EpCAM+/ABCG2+ cells from "cisplatin +" tumors. Data presented as mean ± SEM. Student’s t-test was used in (C, F–I). One way ANOVA was used in (A, J). *p < 0.05, **p < 0.01, ***p < 0.001.
Figure 7
Figure 7
TSD Phenotype and Altruistic Behavior of Cisplatin-Treated CSCs. (A, B) EpCAM+/ABCG2+ cells from cisplatin+ tumors ( Figure 5 ) were cultured under 2% O2 in serum-free media. Flow cytometry monitored HIF-2α and ABCG2 expression over time. Cells from the "cisplatin +" group maintained these markers, suggesting self-sufficiency and potentially an undifferentiated state. Whereas cells from the cisplatin group differentiated on day 4. (C) EpCAM+/ABCG2+ cells from the "cisplatin +" group displayed rapid growth even in deprived conditions (serum-free media, 2% O2) suggesting self-sufficiency. (D) These proliferating EpCAM+/ABCG2+ cells (week 1 and week 2) maintained a secretory phenotype, suggesting they exhibit autocrine and paracrine functions. (E) Conditioned media obtained from EpCAM+/ABCG2+ cells of cisplatin+ group protected the EpCAM+/ABCG2- cells treated with cisplatin. (F) Conditioned media obtained from EpCAM+/ABCG2+ cells (2nd and third week) protected R-CSCs (EpCAM+ABCG2+ cells collected on 4th week as shown in (C) grown in 2% O2+serum free media. (G) Gene expression analysis of R-CSCs (EpCAM+ABCG2+ cells collected on 4th week as shown in (C) is showing high expression of dormancy genes; p21, BMI, CD47. Data presented as mean ± SEM. One way ANOVA was used in (C, D, G); Linear regression analysis for panels (E, F). *p < 0.05, **p < 0.01.
Figure 8
Figure 8
Transient TSD+ phenotype and the reawakening of dormant R-CSCs. Serial transplantation reveals decreased CSC frequency (A) in secondary/tertiary tumors compared to primary, suggesting the transient state of the TSD+ EpCAM+/ABCG2+ CSCs. Cisplatin treatment of tertiary tumors (cisplatin++) triggers a rebound in CSC frequency (B) Faster tumor growth in cisplatin++ group. Tumor cells from these group injected to mice to develop secondary cisplatin++ tumor. (C) rapid increase in the percentage of the EpCAM+/ABCG2+ cells obtained from tumor xenograft and grown in 2% O2+serum free media. (D–F) Xenograft exhibit increased number of TSD+CSCs (EpCAM+/ABCG2+ cells) exhibiting PIM and HIF2alpha during the tumor growth. It shows a decrease of pimonidazole binding and HIF-2α protein levels in cisplatin + tertiary tumors compared to the primary, and reawakened (cisplatin ++) tumors. (G) Immunohistochemistry is showing Hif2alpha expression in EpCAM+/ABCG2+ cells derived xenografts. Yellow arrow indicates the Hif2alpha positive cells: Data represent ± SEM, three independent experiments, Student’s t test. *p<0.05, **p<0.01.
Figure 9
Figure 9
Mobilization of EpCAM+/ABCG2+ cells (enriched in TSD+ CSCs) from cisplatin ++ xenograft. (A, B) In cell Western of EpCAM (green) and ABCG2 (yellow) proteins in CD45 negative PBMCs isolated from cisplatin ++ xenograft (week 8). These cells likely represent TSD+ CTCs. RFU denotes relative fluorescence unit. (C) In Cell ELISA reveals a progressive increase in pimonidazole levels in the CD45 negative PBMC. (D) Progressive increase in the percentage of EpCAM+/ABCG2+/PIM+ cells in the CTCs of primary cisplatin + and Cisplatin ++ tumors, suggesting rising TSD+ CTCs. PBMC derived CD45 negative cells were expanded in the injured conditioned media for a week to obtain tumorospheres, and then, the EpCAM+/ABCG2+/PIM+ cells cell percentage was quantified in the dissociated tumorospheres by flow cytometry. (E, F) Immunohistochemistry detects EpCAM+ cells (red arrows) in the bone marrow (BM) of tertiary cisplatin+ and cisplatin ++ mice [quantified in (F)]. (G) A tumorosphere assay image shows a tumorosphere embedded within a CFU-GM colony in BM derived mononuclear cells cultured in methylcellulose media with GM-CSF (quantified in H&I). Since directly isolating EpCAM+ CTCs can be challenging, we used CD45 negative cells from PBMC of xenograft-bearing mice to enrich EpCAM+/ABCG2+ CTCs. (J) The BM spheroid derived EpCAM+/ABCG2+ cells were subjected to TSD phenotype assays described in Figure 6G . The R-CSCs in the BM spheroids show similar number of ABCG2 cells as the primary tumor data 6G indicating reawakening. Data represent ± SEM, three independent experiments, One Way ANOVA is for (B, H, I). Student’s t-test is for (C, D, F, J). *p<0.05, **p<0.01.
Figure 10
Figure 10
Effect of terazapamine and FM19G11 (TFM) on tumor growth, CSCs, CTCs, and bone marrow (BM). (A) Treatment with TFM (combination of Terazapamine and FM19G11) significantly reduces tumor growth in cisplatin++ xenograft mice. (B) Cisplatin++ xenografts exhibit increase of CSC niche defense (PIM+ cells, TSD+CSCs, TSD+CTCs, R-CSCs), which is decreased after TFM treatment as shown in red color. Please note that R-CSC is enriched in the EpCAM+/ABCG2+ CSCs and CTCs. (C) TFM significantly reduces EpCAM+ cell homing to the bone marrow in cisplatin++ xenograft mice. (D) This schematic proposes a model where platinum exposure triggers dormant CSCs to transform into TSD+ CSCs, and R-CSCs, as a part of altruistic tumor self defense. These TSD+ CSCs might exhibit altruistic behavior, supporting the niche as well as R-CSCs for future tumor growth. The R-CSCs re-enter dormancy while retaining a "memory" of past stress that allows them to reawaken upon encountering similar stress (like cisplatin) in the future. This memory-driven reactivation of R-CSCs and the associated altruism of the TSD+ phenotype contributes to chemoresistance. (A–C) Data represents ± SEM, n=4 independent experiments, student t test, ** p<0.01.

References

    1. Bagal S, Budukh A, Thakur JS, Dora T, Qayyumi B, Khanna D, et al. . Head and neck cancer burden in India: an analysis from published data of 37 population-based cancer registries. Ecancermedicalscience. (2023) 17:1603. doi: 10.3332/ecancer.2023.1603 - DOI - PMC - PubMed
    1. Bernier J, Domenge C, Ozsahin M, Matuszewska K, Lefèbvre JL, Greiner RH, et al. . Postoperative irradiation with or without concomitant chemotherapy for locally advanced head and neck cancer. N Engl J Med. (2004) 350:1945–52. doi: 10.1056/NEJMoa032641 - DOI - PubMed
    1. Cooper JS, Pajak TF, Forastiere AA, Jacobs J, Campbell BH, Saxman SB, et al. . Postoperative concurrent radiotherapy and chemotherapy for high-risk squamous-cell carcinoma of the head and neck. N Engl J Med. (2004) 350:1937–44. doi: 10.1056/NEJMoa032646 - DOI - PubMed
    1. Pignon JP, le Maître A, Maillard E, Bourhis J, Group M-NC . Meta-analysis of chemotherapy in head and neck cancer (MACH-NC): an update on 93 randomised trials and 17,346 patients. Radiother Oncol. (2009) 92:4–14. doi: 10.1016/j.radonc.2009.04.014 - DOI - PubMed
    1. Strojan P, Vermorken JB, Beitler JJ, Saba NF, Haigentz M, Bossi P, et al. . Cumulative cisplatin dose in concurrent chemoradiotherapy for head and neck cancer: A systematic review. Head Neck. (2016) 38 Suppl 1:E2151–8. doi: 10.1002/hed.24026 - DOI - PubMed

MeSH terms

LinkOut - more resources