

A data-driven approach for improved quantification of in vivo metabolic conversion rates of hyperpolarized [1-13C]pyruvate
- PMID: 39963732
- PMCID: PMC11971488
- DOI: 10.1002/mrm.30445
A data-driven approach for improved quantification of in vivo metabolic conversion rates of hyperpolarized [1-13C]pyruvate
Abstract
Purpose: Accurate quantification of metabolism in hyperpolarized (HP) 13C MRI is essential for clinical applications. However, kinetic model parameters are often confounded by uncertainties in radiofrequency flip angles and other model parameters.
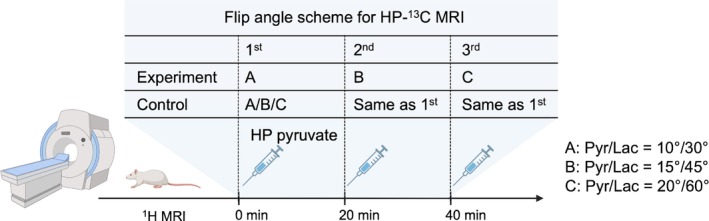
Methods: A data-driven kinetic fitting approach for HP 13C-pyruvate MRI was proposed that compensates for uncertainties in the B1 + field. We hypothesized that introducing a scaling factor to the flip angle to minimize fit residuals would allow more accurate determination of the pyruvate-to-lactate conversion rate (kPL). Numerical simulations were performed under different conditions (flip angle, kPL, and T1 relaxation), with further testing using HP 13C-pyruvate MRI of rat liver and kidneys.
Results: Simulations showed that the proposed method reduced kPL error from 60% to 1% when the prescribed and actual flip angles differed by 60%. The method also showed robustness to T1 uncertainties, achieving median kPL errors within ±3% even when the assumed T1 was incorrect by up to a factor of 2. In rat studies, better-quality fitting for lactate signals (a 1.4-fold decrease in root mean square error [RMSE] for lactate fit) and tighter kPL distributions (an average of 3.1-fold decrease in kPL standard deviation) were achieved using the proposed method compared with when no correction was applied.
Conclusion: The proposed data-driven kinetic fitting approach provided a method to accurately quantify HP 13C-pyruvate metabolism in the presence of B1 + inhomogeneity. This model may also be used to correct for other error sources, such as T1 relaxation and flow, and may prove to be clinically valuable in improving tumor staging or assessing treatment response.
Keywords: flip angle correction; hyerpolarized C‐13 pyruvate; metabolic conversion analysis; metabolic imaging.
© 2025 The Author(s). Magnetic Resonance in Medicine published by Wiley Periodicals LLC on behalf of International Society for Magnetic Resonance in Medicine.
Figures


References
MeSH terms
Substances
Grants and funding
- P41 EB013598/EB/NIBIB NIH HHS/United States
- R01 CA249909/CA/NCI NIH HHS/United States
- P41EB013598/NH/NIH HHS/United States
- R01 DK115987/DK/NIDDK NIH HHS/United States
- R01CA280071/NH/NIH HHS/United States
- R33 HL161816/HL/NHLBI NIH HHS/United States
- R33HL161816/NH/NIH HHS/United States
- U01 CA232320/CA/NCI NIH HHS/United States
- S10 OD025077/OD/NIH HHS/United States
- R01 CA256740/CA/NCI NIH HHS/United States
- R01CA238379/NH/NIH HHS/United States
- R01 CA280071/CA/NCI NIH HHS/United States
- U01 EB026412/EB/NIBIB NIH HHS/United States
- R01 CA238379/CA/NCI NIH HHS/United States
- R01CA249909/NH/NIH HHS/United States
- U01EB026412/NH/NIH HHS/United States
- P30 DK056341/DK/NIDDK NIH HHS/United States
- R01CA256740/NH/NIH HHS/United States
- S10OD025077/NH/NIH HHS/United States
- R01DK115987/NH/NIH HHS/United States
LinkOut - more resources
Full Text Sources
Medical
Research Materials
Miscellaneous
