. 2025 Mar 4;41(8):5387-5398.
doi: 10.1021/acs.langmuir.4c04942. Epub 2025 Feb 18.

Patchy Charge Distribution Affects the pH in Protein Solutions during Dialysis

Affiliations

Patchy Charge Distribution Affects the pH in Protein Solutions during Dialysis

Sebastian P Pineda et al. Langmuir. .

Abstract

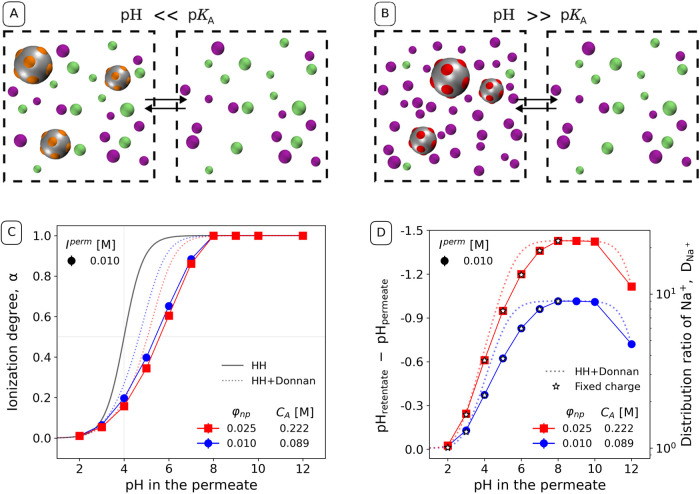
When using dialysis ultra- or diafiltration to purify protein solutions, a dialysis buffer in the permeate is employed to set the pH in the protein solution. Failure to achieve the target pH may cause undesired precipitation of the valuable product. However, the pH in the permeate differs from that in the retentate, which contains the proteins. Experimental optimization of the process conditions is time-consuming and expensive, while accurate theoretical predictions still pose a major challenge. Current models of dialysis account for the Donnan equilibrium, acid-base properties, and ion-protein interactions, but they neglect the patchy distribution of ionizable groups on the proteins and its impact on the solution properties. Here, we present a simple computational model of a colloidal particle with weakly acidic sites on the surface, organized in patches. This minimalistic model allows systematic variation of the relevant parameters, while simultaneously demonstrating the essential physics governing the acid-base equilibria in protein solutions. Using molecular simulations in the Grand-Reaction ensemble, we demonstrate that interactions between ionizable sites significantly affect the nanoparticle charge and thereby contribute to pH difference between the permeate and retentate. We show that the significance of this contribution increases if the ionizable sites are located on a smaller patch. Protein solutions are governed by the same physics as our simple model. In this context, our results show that models which aim to quantitatively predict the pH in protein solutions during dialysis need to account for the patchy distribution of ionizable sites on the protein surface.


Conflict of interest statement

The authors declare no competing financial interest.

Figures

Figure 1
Figure 1
Schematic illustration of the studied system: a solution of nanoparticles with acidic ionizable groups and small ions (H+, OH, Na+ and Cl) on the left (retentate), coupled to permeate containing only small ions on the right.
Figure 2
Figure 2
Schematic representation of the Donnan effect on the partitioning of small ions in systems with (A) low and (B) high concentration of acidic sites, cA. Color code is the same as that in Figure 1. (C) Distribution ratio of Na+ between the retentate and the permeate, varying nanoparticle volume fraction (bottom axis) or its equivalent concentration of acidic sites (top axis) at various ionic strengths in the permeate. Different symbol shapes and colors encode ionic strength in the permeate. The solid lines represent the result of Donnan theory using the ideal gas approximation. The estimated statistical errors are comparable to the symbol size.
Figure 3
Figure 3
Distribution ratio of Na+ between the retentate and permeate at various volume fractions of the uncharged nanoparticles and various ionic strengths of the permeate. Different symbol shapes encode ionic strengths in the permeate, while different colors encode nanoparticle sizes, as indicated in the legend. The estimated statistical errors are comparable to the symbol size.
Figure 4
Figure 4
Schematic representation of the distribution of small ions at various pH values at (A) pH < pKA and (B) pH > pKA. Color code is the same as Figure 1. (C) Ionization degree of the nanoparticles as a function of the pH in the permeate. (D) ΔpH (left axis) and the corresponding distribution ratio of Na+ (right axis) as a function of pH in the permeate at various nanoparticle volume fractions, ϕnp. Because ΔpH = −log10DNa+, both axes are linked to the same data, just expressed as different quantity. Different colors encode nanoparticle volume fraction (concentration of acidic sites), as indicated in the legend. The black solid line in the ionization degree plot corresponds to the ideal Henderson–Hasselbalch equation (eq 11). The dotted colored lines in both plots correspond to eq 11 corrected by ΔpH from eq 4. The star-shaped markers correspond to the simulation of systems with a fixed fractional charge, as described in the text. The estimated statistical errors are comparable to the symbol size.
Figure 5
Figure 5
(A) Snapshots of the 4 different simulated charge distributions of the acidic ionizable groups on the nanoparticle surface. Color code is the same as that in Figure 1. (B) Ionization degree of the nanoparticles at different pH values. (C) Distribution ratio of Na+ between the retentate and permeate at various pH values. The gray data points correspond to the simulation results of a system with no interactions (No Inter). Different colors encode different degree of patchiness, θ, as indicated in the legend. The black solid line in the ionization degree plot corresponds to the ideal case computed by the Henderson–Hasselbalch equation (HH) and the dashed colored lines in both plots correspond to the ideal plus the Donnan contribution (HH+Donnan). The estimated statistical errors are comparable to the symbol size.

References

    1. Liderfelt J.; Royce J.. Biopharmaceutical Processing; Jagschies G.; Lindskog E.; Ła̧cki K.; Galliher P., Eds.; Elsevier, 2018; pp 441–453.
    1. Zydney A. L. New developments in membranes for bioprocessing - A review. J. Membr. Sci. 2021, 620, 11880410.1016/j.memsci.2020.118804. - DOI
    1. Stoner M. R.; Fischer N.; Nixon L.; Buckel S.; Benke M.; Austin F.; Randolph T. W.; Kendrick B. S. Protein-solute interactions affect the outcome of ultrafiltration/diafiltration operations. J. Pharm. Sci. 2004, 93, 2332–2342. 10.1002/jps.20145. - DOI - PubMed
    1. Bolton G. R.; Boesch A. W.; Basha J.; LaCasse D. P.; Kelley B. D.; Acharya H. Effect of protein and solution properties on the donnan effect during the ultrafiltration of proteins. Biotechnol. Prog. 2011, 27, 140–152. 10.1002/btpr.523. - DOI - PubMed
    1. Briskot T.; Hillebrandt N.; Kluters S.; Wang G.; Studts J.; Hahn T.; Huuk T.; Hubbuch J. Modeling the Gibbs-Donnan effect during ultrafiltration and diafiltration processes using the Poisson-Boltzmann theory in combination with a basic Stern model. J. Membr. Sci. 2022, 648, 12033310.1016/j.memsci.2022.120333. - DOI

LinkOut - more resources