. 2025 Mar 5;17(9):13632-13645.
doi: 10.1021/acsami.4c22450. Epub 2025 Feb 18.

Microfluidic 3D Bioprinting of Foamed Fibers with Controlled Micromorphology

Affiliations

Microfluidic 3D Bioprinting of Foamed Fibers with Controlled Micromorphology

Federico Serpe et al. ACS Appl Mater Interfaces. .

Abstract

The synergistic integration of microfluidic technologies with additive manufacturing systems is advancing the development of innovative platforms to 3D bioprint scaffolds for tissue engineering with unparalleled biological relevance. Significant interest is growing in realizing porous functionally graded materials (pFGMs) that can resemble the hierarchical organization of porosity found in bone tissue. This study introduces a method for fabricating porous scaffolds based on the real-time generation of a liquid foam, which is gelled, forming porous fibers that are organized into structured matrixes using a 3D bioprinting system. The primary advantage of this approach is the possibility to adjust bubble size during printing dynamically, modifying the characteristics of the deposited foamed filaments online and in one step. As a result, locally-defined and tailor-made pores can be distributed in 3D structures with high spatial accuracy. Besides the mechanical and morphological characterization of diverse microarchitectures, we also explored the biocompatibility of the proposed approach by directly embedding osteosarcoma cells within the biomaterial. Results demonstrated the biocompatibility of the proposed methodology and revealed the influence of the interior microporosity on cell proliferation, highlighting the potential for creating tailored tissue microenvironments. The findings underscore the versatility of the presented 3D bioprinting system and its potential in fabricating biomimetic scaffolds with tailored morphological gradients, representing a substantial advancement in pFGM synthesis, with direct implications in regenerative medicine and tissue engineering.

Keywords: 3D bioprinting; foam; gradient; microfluidic; porous functionally graded materials; printhead.


Conflict of interest statement

The authors declare no competing financial interest.

Figures

Figure 1
Figure 1
Set-up overview. (a) Rendering of the experimental setup with a close-up of the various components. In the background, the microfluidic printhead mounted on the bioprinter simulates the printing of a 3D scaffold (in red); on the left, front and lateral view of the printing head, composed of two microfluidic chips connected in series with a plastic tube. The two close-ups show the generation of the liquid foam in the first microchip and the formation of a solid bubble-filled fiber at the outlet of the second chip. (b) Rendering of the microfluidic bubble generator and enlarged image of internal microchannels. The chip is equipped with (i) an inlet for the biomaterial ink and (ii) an inlet for the air, both provided with a filtering structure and (iii) an outlet. (c) Rendering of the two extruders previously developed. The first chip contains a simple flow-focusing junction, while the second chip integrates a micromixer before the flow-focusing junction. (d) Macro- and micrographs of a 3D-printed foamed scaffold at different magnifications reveal the presence of tiny air bubbles embedded within the fibers. On the right, a fluorescence image of the printed foamed fibers containing FITC-labeled alginate confirms the presence of voids within the printed biomaterial ink.
Figure 2
Figure 2
Characterization of the microfluidic foam. (a) Frames extracted from acquired videos reporting bubble formation fixing the flow rate to 35 μL/min and varying air pressure from 700 to 1600 mbar. The scale bar is 100 μm. (b) Heat map showing the mean bubble diameter estimated for different flow rates of the biomaterial ink (columns) and increasing air pressure values (rows). (c) Heat map showing the percentage of the air volume fraction calculated for different flow rates of the biomaterial ink (columns) and increasing air pressure values (rows). (d) Frequency of bubble production for 25, 30, 35, and 40 μL/min within the operational pressure range. The lines connecting dots are only to help the readers. (e) 3D histogram showing the distribution of bubble diameters for a fixed flow rate of 35 μL/min and pressure ranging from 700 to 1600 mbar. The occurrences are expressed as a percentage of the relative frequency. Results are expressed as mean ± SD of at least three replicates for each experiment.
Figure 3
Figure 3
Diameter of foamed fibers and foamed scaffolds properties. a) Microscope images of deposited foamed fibers at different air pressures. The images encased in the colored box represent all the pressure values, which do not cause an increase in fiber diameter. The scale bar is 100 μm. b) Graph showing the diameter of foam-filled fibers (red line) and the correspondent volume fraction (blue line) as a function of the air pressure injected with a fixed flow rate of 35 μL/min. The portion of the graph with colored background represents the range of pressure values that keep the fiber diameter constant. c) On the left, a close-up of 3D lattices realized with foamed fibers, showing an increase in bubble size and number for different air pressure conditions. On the right, the schematization of the different types of 3D-printed scaffolds. While single-porosity scaffolds present a constant porosity along the 3D structure, multi-porosity constructs vary their internal porosity in 3D with predetermined patterns. d) Heights of the single- and multi-porosity 3D printed scaffolds. The dashed line represents the height of the control samples (non-foamed). e) Elastic modulus of 3D printed porous constructs. f) Toughness of 3D printed porous constructs. Statistical significance was calculated via one-way ANOVA. Results are expressed as mean ± SD of at least three replicates for each experiment, *p<0.05, **p<0.01, ***p<0.001, ****p<0.0001.
Figure 4
Figure 4
μCT scans of single- and multiporosity constructs. (a) Tomographic analysis of high porosity scaffolds. (i) 2D projection of an axial cross-section to visualize internal fiber porosity. On the right, reconstructions of 3D printed constructs were observed from a (ii) 45° and (iii) 90° angle. (b) Tomographic analysis of low porosity scaffolds. (i) 2D projection of an axial cross-section to visualize internal fiber porosity. On the right, reconstructions of 3D printed constructs were observed from a (ii) 45° and (iii) 90° angle. (c) Tomographic analysis of scaffolds with alternate porosity. (i) 2D projection of an axial cross-section to visualize internal fiber porosity. On the right, reconstructions of 3D printed constructs were observed from a (ii) 45° and (iii) 90° angle. (d) Tomographic analysis of scaffolds with gradual porosity variation. (i) 2D projection of an axial cross-section to visualize internal fiber porosity. On the right, reconstructions of 3D printed constructs were observed from a (ii) 45° and (iii) 90° angle. All scale bars are 500 μm.
Figure 5
Figure 5
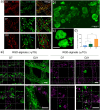
Viability staining of MG63 cells encapsulated in the foamed biomaterial ink. (a) Observation of cellular viability during 3 weeks of culture in condition C1. Bioprinted MG63 cells calcein staining on days 1, 7, and 21. Cells were prelabeled before encapsulation (red) and were marked green only if metabolically active. White arrows indicate clusters of 30–70 μm in diameter forming on day 7, while yellow and light blue arrows indicate the presence of massive clusters (70–120 μm in diameter) on day 21. These agglomerates appear elongated (yellow arrow) or perfectly round (light blue arrow), whether they are formed due to coalesced or single bubbles, respectively. The scale bar is 100 μm. (b) An enlarged image showing the formation of cellular clusters of different shapes and dimensions on day 21. (c) 3D reconstruction of a round cluster of bubbles to show the absence of cells in the central area. (d) Evaluation of the mean diameter of cellular aggregates formed within foamed fibers. (e) Comparison of the calcein staining performed after 1 and 3 weeks of culture in samples containing RGD-immobilized alginate that were treated or not with μTG shows a difference in cell proliferation after 1 and 3 weeks. Scale bars are all 200 μm. Statistical significance was calculated via one-way ANOVA. Results are expressed as mean ± SD of at least three replicates for each experiment, ***p < 0.001, ****p < 0.0001.

References

    1. Ma Y.; Wang X.; Su T.; Lu F.; Chang Q.; Gao J. Recent Advances in Macroporous Hydrogels for Cell Behavior and Tissue Engineering. Gels 2022, 8 (10), 606.10.3390/gels8100606. - DOI - PMC - PubMed
    1. Li X.; Sun Q.; Li Q.; Kawazoe N.; Chen G. Functional Hydrogels With Tunable Structures and Properties for Tissue Engineering Applications. Front. Chem. 2018, 6 (OCT), 1–20. 10.3389/fchem.2018.00499. - DOI - PMC - PubMed
    1. Annabi N.; Nichol J. W.; Zhong X.; Ji C.; Koshy S.; Khademhosseini A.; Dehghani F. Controlling the Porosity and Microarchitecture of Hydrogels for Tissue Engineering. Tissue Eng. Part B Rev. 2010, 16 (4), 371–383. 10.1089/ten.teb.2009.0639. - DOI - PMC - PubMed
    1. Foudazi R.; Zowada R.; Manas-Zloczower I.; Feke D. L. Porous Hydrogels: Present Challenges and Future Opportunities. Langmuir 2023, 39 (6), 2092–2111. 10.1021/acs.langmuir.2c02253. - DOI - PubMed
    1. Liu X.; Smith L. A.; Hu J.; Ma P. X. Biomimetic Nanofibrous Gelatin/Apatite Composite Scaffolds for Bone Tissue Engineering. Biomaterials 2009, 30 (12), 2252–2258. 10.1016/j.biomaterials.2008.12.068. - DOI - PMC - PubMed

Substances

LinkOut - more resources