. 2025 Feb 3;66(2):45.
doi: 10.1167/iovs.66.2.45.

Ultrastructural Aspects of Corneal Functional Recovery in Rats Following Intrastromal Keratocyte Injection

Affiliations

Ultrastructural Aspects of Corneal Functional Recovery in Rats Following Intrastromal Keratocyte Injection

Qian Ma et al. Invest Ophthalmol Vis Sci. .

Abstract

Purpose: Donor tissue shortfalls and postsurgical complications are driving novel corneal tissue regeneration approaches. Corneal stromal keratocytes (CSKs) have shown promise in promoting corneal repair and restoring transparency. We investigated the impact of intrastromal CSK injection on corneal ultrastructure and proteoglycan (PG) distribution in a rat injury model.

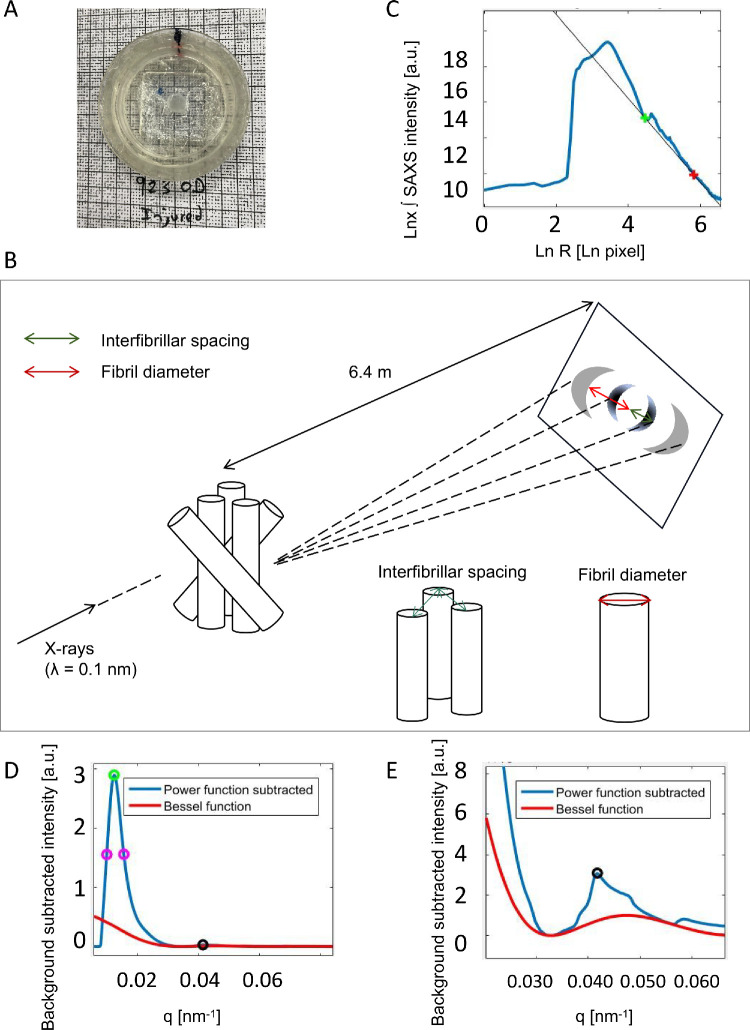
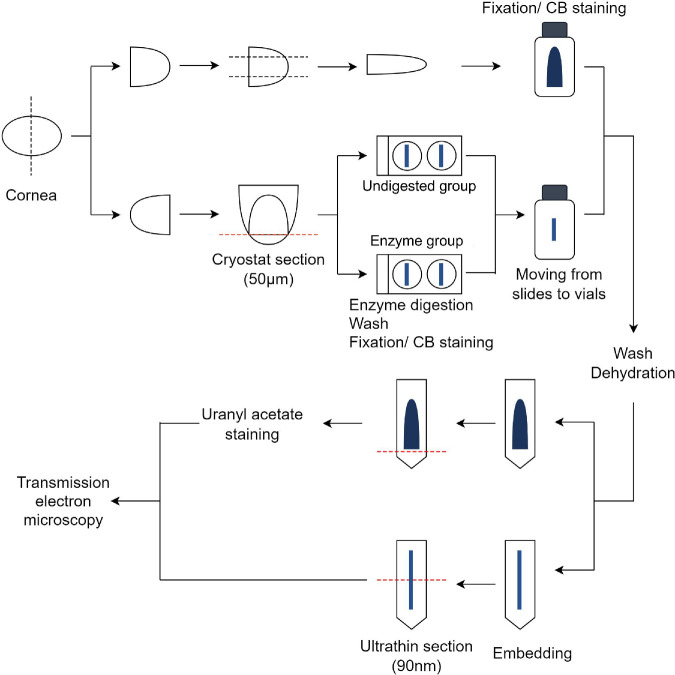
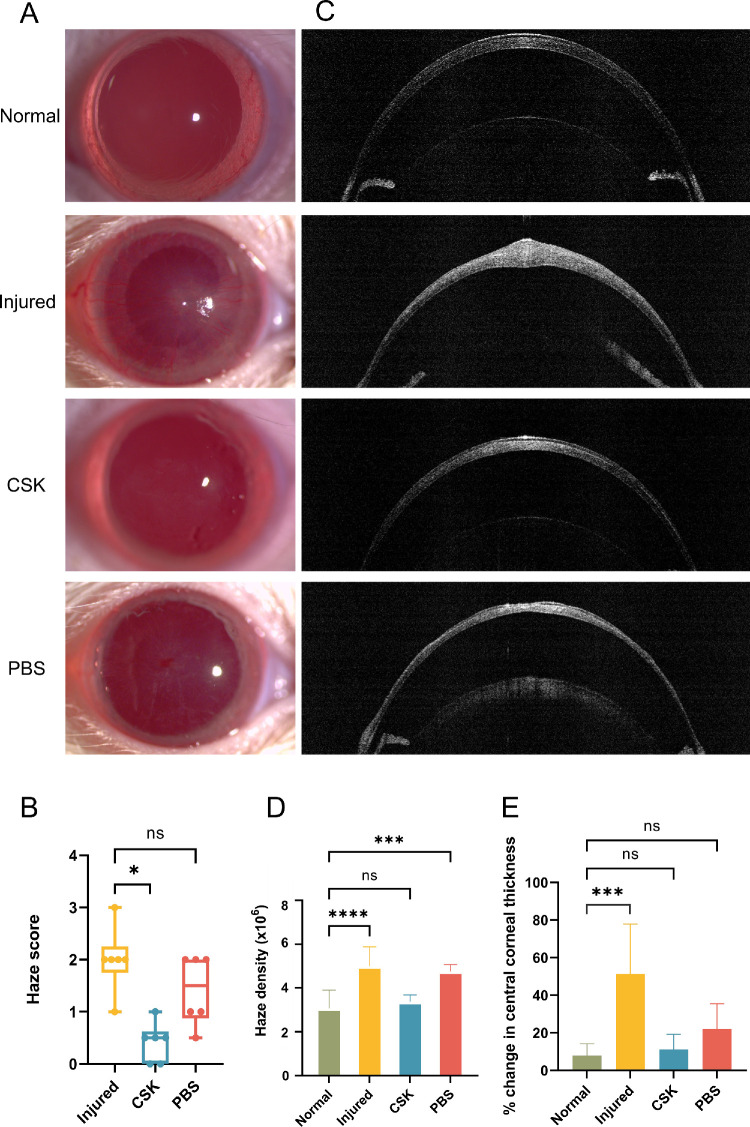
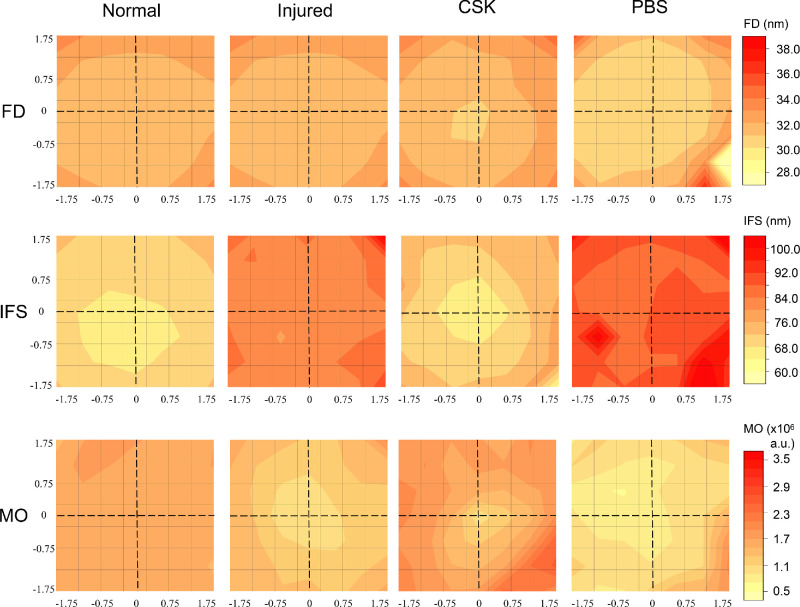
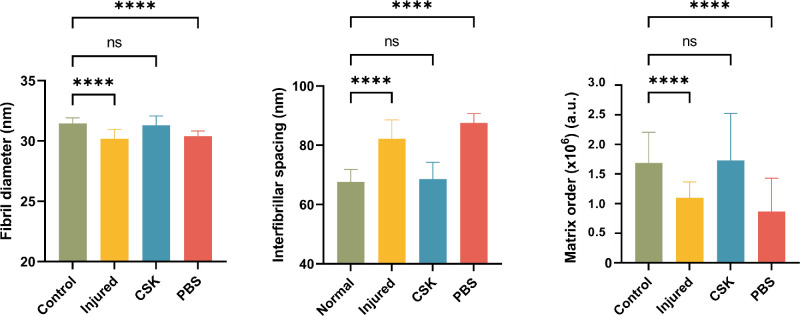
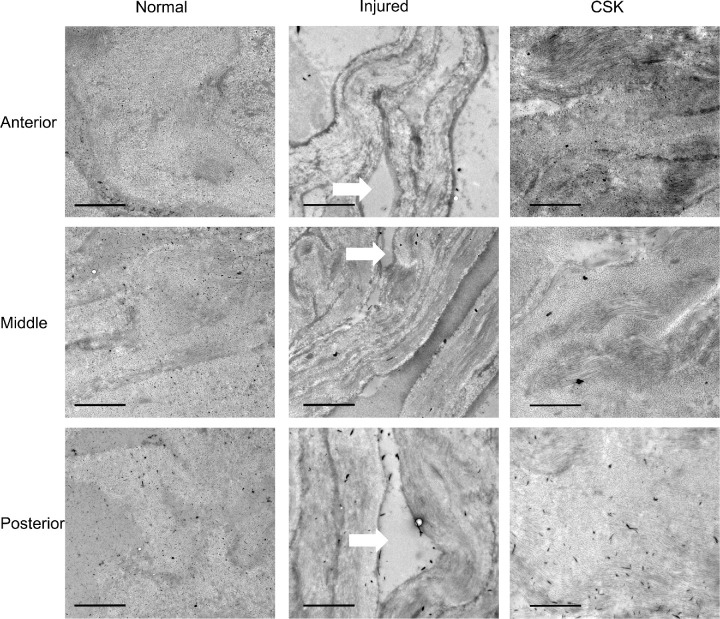
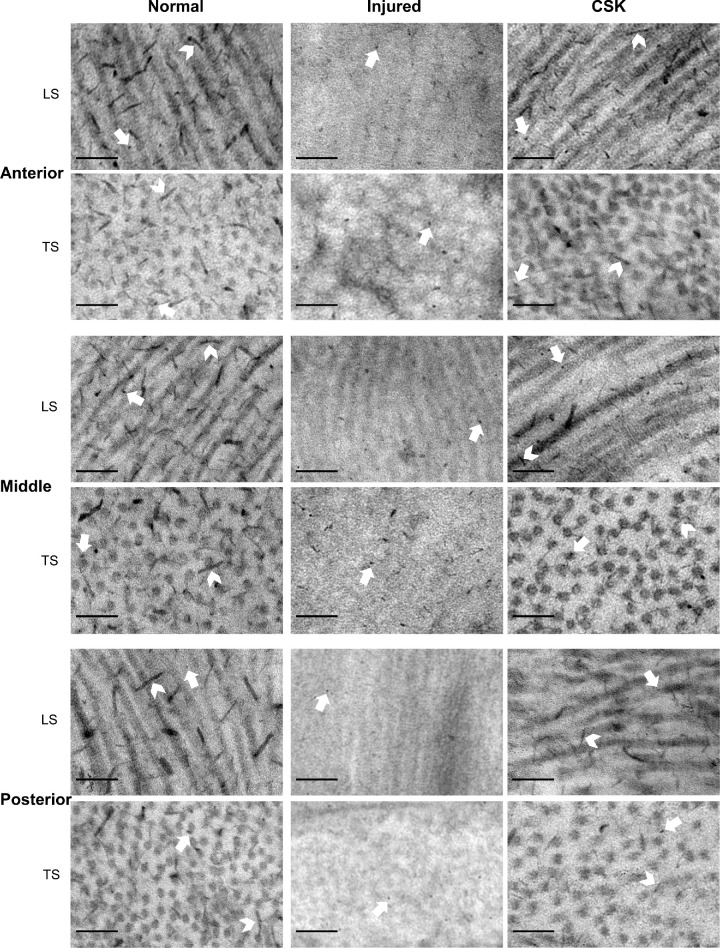
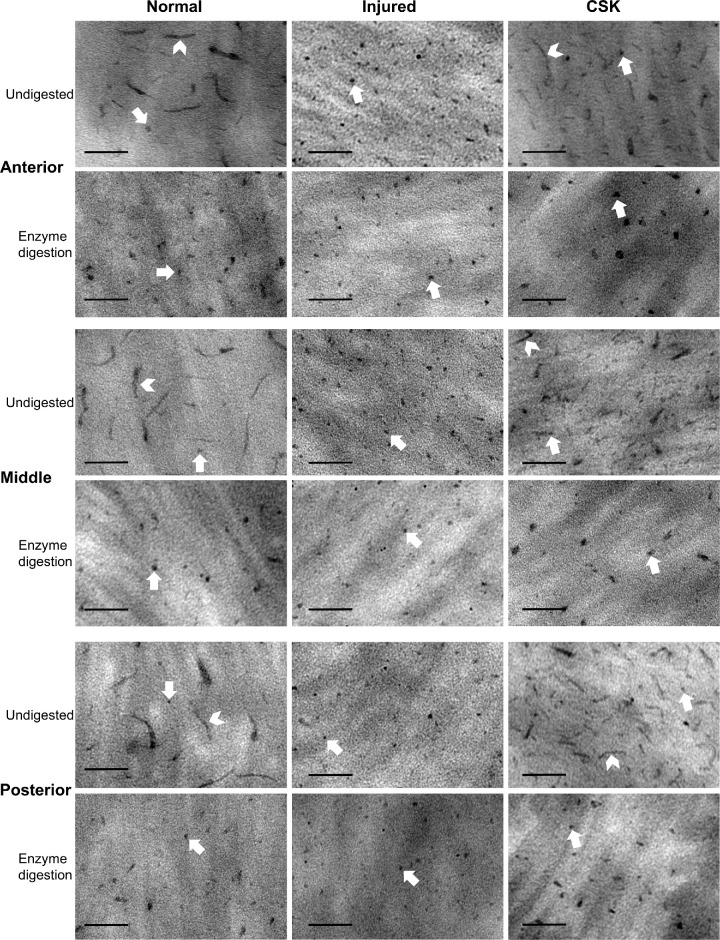
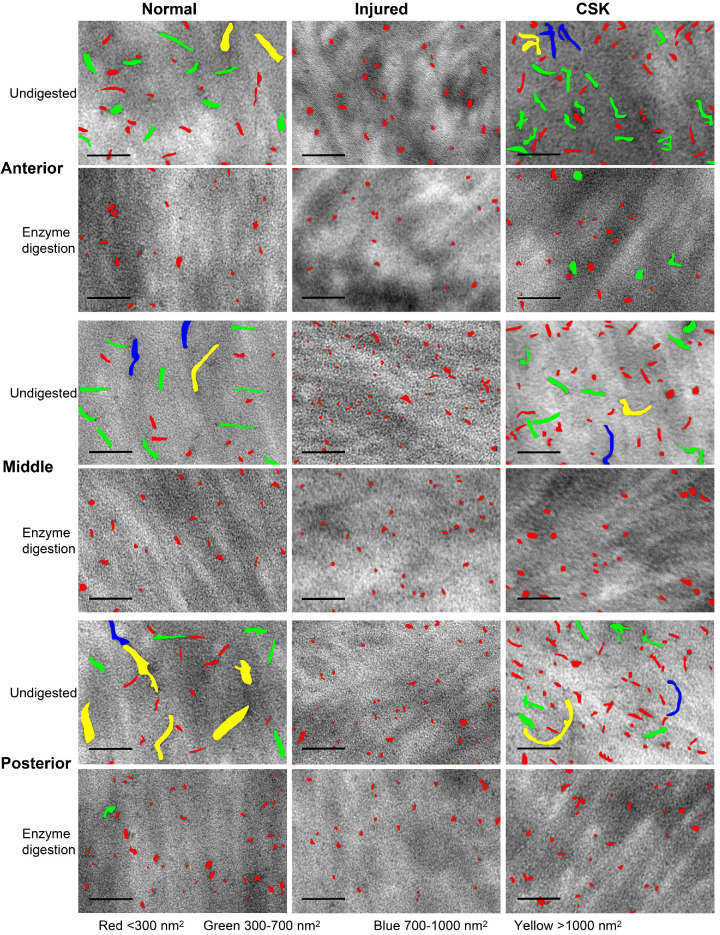
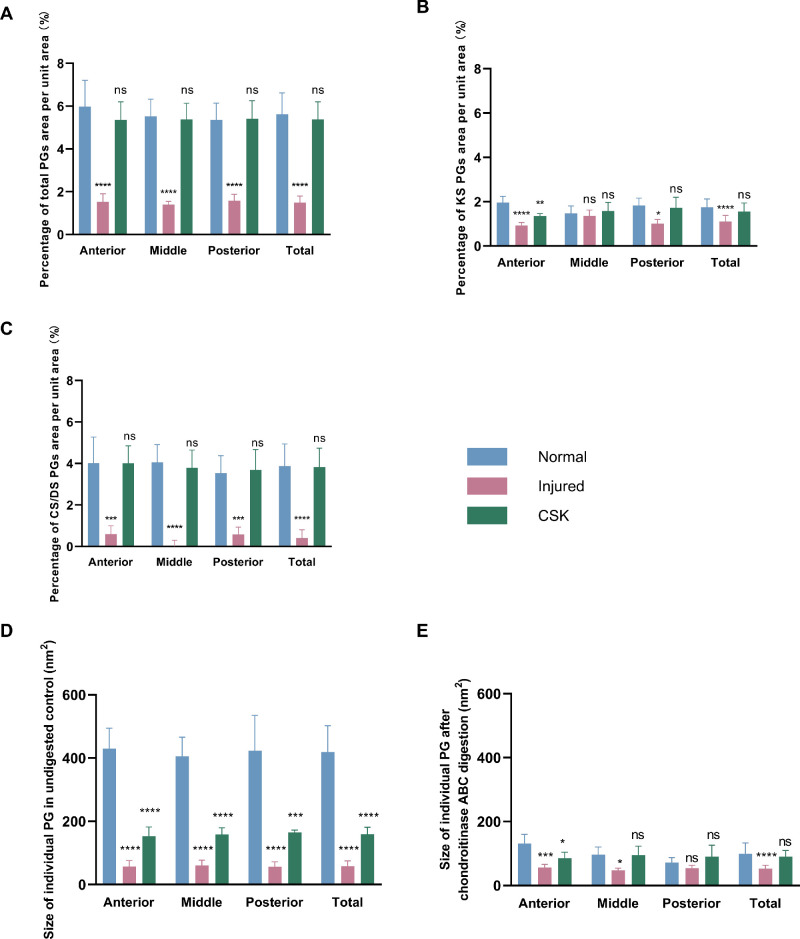
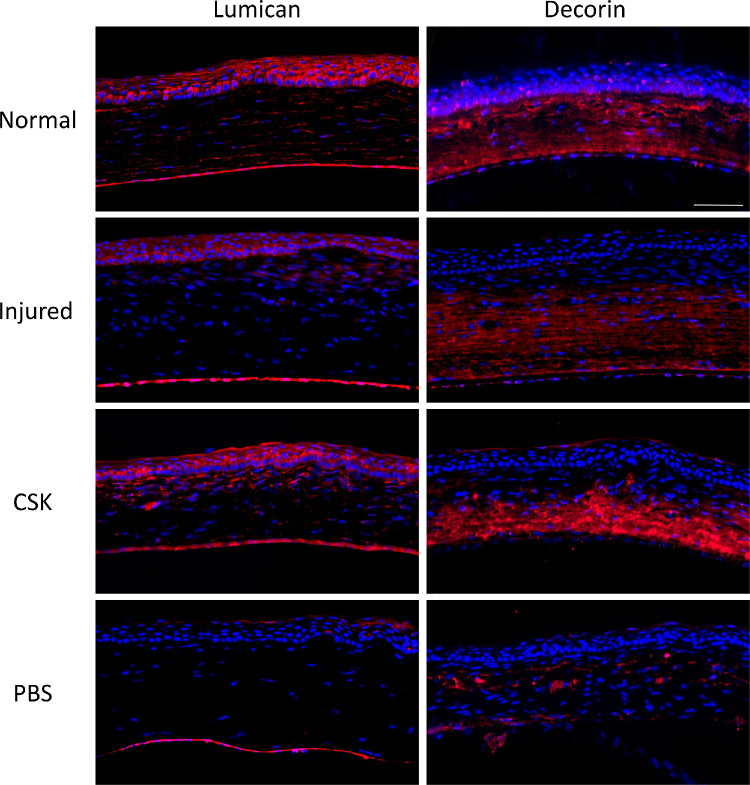
Methods: Rats were divided into four groups: normal (n = 12), injured (irregular phototherapeutic keratectomy centrally; n = 6), CSK (injured + human CSK intrastromal injection; n = 6), and PBS (injured + PBS injection; n = 6). Three weeks after treatment, corneas were examined by slit-lamp and optical coherence tomography. Corneal ultrastructure was analysed via small-angle x-ray scattering (collagen fibril diameter, interfibrillar spacing and matrix order), transmission electron microscopy with cuprolinic blue before and after chondroitinase digestion (CS/DS and KS PGs), and immunofluorescence staining (lumican and decorin).

Results: Irregular phototherapeutic keratectomy caused corneal opacity and significantly disrupted stromal ultrastructure, characterized by increased haze density (P < 0.0001), change in central corneal thickness (P = 0.0005), and interfibrillar spacing (P < 0.0001), along with decreased fibril diameter (P < 0.0001), matrix order (P < 0.0001), CS/DS (P < 0.0001) and KS (P < 0.0001) PGs, lumican, and decorin. CSK injection recovered corneal clarity and native stromal ultrastructure, with haze density (P = 0.8086), change in central corneal thickness (P = 0.9503), fibril diameter (P = 0.1139), interfibrillar spacing (P = 0.5879), matrix order (P = 0.9999), CS/DS (P = 0.9969) and KS (P = 0.2877) PGs, lumican, and decorin returning to normal. In contrast, the PBS group exhibited similar corneal injury responses to the injured group.

Conclusions: CSK injection resolved early stage corneal scarring by restoring stromal collagen arrangement and PG distribution, further endorsing its potential for treating corneal opacities.


Conflict of interest statement

Disclosure: Q. Ma, None; A.K. Riau, None; R.D. Young, None; J.S. Bell, None; O. Shebanova, None; N.J. Terrill, None; G.H.F. Yam, None; E. Han, None; K.M. Meek, None; J.S. Mehta, None; C. Boote, None

Figures

Figure 1.
Figure 1.
Collagen SAXS data collection and analysis. (A) Rat cornea sealed in x-ray sample cell. (B) Schematic of SAXS method to quantify fibrillar collagen parameters. (C) Logarithmic background noise (solid black line) subtraction from sample signal. (D) Resulting background-subtracted equatorial SAXS collagen signal (blue) with software-detected interfibrillar peak position marked by green circle and detected purple circles denoting the peak width at half height. The three circle coordinates were used to determine the height to half height width ratio of the interfibrillar peak as measure of the collagen matrix order. The red line shows the fitted model of the equatorial cylinder transform (based on a first order Bessel function)—the scatter from an isolated fibril. The black hollow circle corresponds with the third meridional reflection arising from the collagen axial periodicity (resolvable from the equatorial signal in expanded view in E). (E) Expanded view of the first subsidiary maximum peak region of the cylinder transform (red), showing model fitting to SAXS equatorial data (blue). The fitted peak position provides a measurement of the average fibril diameter. The detected meridional collagen axial D-period third order peak (black circle) is resolvable from the equatorial signal.
Figure 2.
Figure 2.
Flowchart for electron microscopy sample preparation. The black dotted lines denote regular scalpel dissection lines, while the red dashed lines indicate cryostat or ultramicrotome sectioning planes. CB, cuprolinic blue.
Figure 3.
Figure 3.
Results of postoperative ophthalmic examination. (A) Corneal slit-lamp photographs of normal, injured, CSK, and PBS groups. (B) Comparison of slit lamp-based haze score between injured, CSK and PBS groups. (C) Corneal AS-OCT images of the normal, injured, CSK, and PBS groups. (D) Comparison of AS-OCT–based haze density in the normal, injured, CSK, and PBS groups. (E) Comparison of changes in central corneal thickness compared with preoperative in the normal, injured, CSK, and PBS groups. Statistical significance is indicated as follows: *P < 0.05; ***P < 0.001; ****P < 0.0001; ns, P ≥ 0.05.
Figure 4.
Figure 4.
Contour maps of average collagen fibril diameter (FD), interfibrillar spacing (IFS), and matrix order (MO) for the normal, injured, CSK, and PBS groups. The central 3.5 mm × 3.5 mm of each cornea at 0.5 mm × 0.5 mm intervals (7 × 7 data points for each cornea).
Figure 5.
Figure 5.
Comparison of average collagen fibril diameter, interfibrillar spacing, and matrix order in the normal, injured, CSK, and PBS groups within the central 2 mm × 2 mm area (13 data points per cornea, n = 156 for the normal group, n = 65 for the injured and PBS groups, and n = 78 for the CSK group). Statistical significance is indicated as follows: ****P < 0.0001; ns, P ≥ 0.05 as compared with the normal group.
Figure 6.
Figure 6.
TEM images with CB staining in the anterior, middle, and posterior stroma of the normal, injured, and CSK groups. Arrows denote collagen-free lakes in injured group. (Scale bar, 2 µm; original magnification ×1,500.)
Figure 7.
Figure 7.
TEM images with CB staining of anterior, middle, and posterior corneal stroma of normal, injured, and CSK groups. TS, transverse section. Arrowheads, filamentous PGs; Arrow, dot-like PGs. (Scale bar, 100 nm; original magnification, ×12,000.)
Figure 8.
Figure 8.
TEM images of chondroitinase ABC enzyme-digested specimens and undigested controls in the anterior, middle, and posterior stroma of normal, injured, and CSK groups. Arrowheads, filamentous PGs; Arrow, dot-like PGs. (LS without uranyl acetate staining.) (Scale bar, 100 nm; original magnification, ×20,000.)
Figure 9.
Figure 9.
Manually marked PGs in the anterior, middle, and posterior stroma of the normal, injured, and CSK groups before and after chondroitinase ABC enzyme digestion using the ROI Manager function in Fiji software. Different colors represent the varying sizes of individual PG areas: red, <300 nm²; green, 300 to 700 nm²; blue, 700 to 1000 nm²; yellow, >1000 nm². The samples were not stained with uranyl acetate and are presented as a LS at an original magnification of ×20,000. (Scale bar, 100 nm.)
Figure 10.
Figure 10.
Quantitative analysis of CB-TEM. Comparison of the percentage of the total area of PGs (A), KS PGs (B), and CS/DS PGs (C) in the unit area in the anterior, middle, posterior, and entire corneal stroma of the normal, injured, and CSK groups. Comparison of average size of individual PGs in undigested control (D) and after enzyme digestion (E) in the anterior, middle, posterior, and entire corneal stroma of normal, injured, and CSK groups. Statistical significance compared with the corresponding normal group is indicated as follows: *P < 0.05; **P < 0.01; ***P < 0.001; ****P < 0.0001; ns, P ≥ 0.05.
Figure 11.
Figure 11.
Immunofluorescence staining images of lumican and decorin for the normal, injured, CSK, and PBS groups. (Scale bar, 100 µm.)

Similar articles

References

    1. Meek KM, Knupp C.. Corneal structure and transparency. Prog Retin Eye Res. 2015; 49: 1–16. - PMC - PubMed
    1. Hassell JR, Birk DE.. The molecular basis of corneal transparency. Exp Eye Res. 2010; 91: 326–335. - PMC - PubMed
    1. Chen S, Mienaltowski MJ, Birk DE.. Regulation of corneal stroma extracellular matrix assembly. Exp Eye Res. 2015; 133: 69–80. - PMC - PubMed
    1. Gesteira TF, Verma S, Coulson-Thomas VJ. Small leucine rich proteoglycans: biology, function and their therapeutic potential in the ocular surface. Ocul Surf. 2023; 29: 521–536. - PMC - PubMed
    1. Scott JE, Haigh M.. Identification of specific binding sites for keratan sulphate proteoglycans and chondroitin-dermatan sulphate proteoglycans on collagen fibrils in cornea by the use of cupromeronic blue in ‘critical-electrolyte-concentration’ techniques. Biochem J. 1988; 253: 607–610. - PMC - PubMed

LinkOut - more resources