. 2025 Feb 8;53(4):gkaf095.
doi: 10.1093/nar/gkaf095.

Crossovers are regulated by a conserved and disordered synaptonemal complex domain

Affiliations

Crossovers are regulated by a conserved and disordered synaptonemal complex domain

Ana Rita Rodrigues Neves et al. Nucleic Acids Res. .

Abstract

During meiosis, the number and distribution of crossovers (COs) must be precisely regulated through CO assurance and interference to prevent chromosome missegregation and genomic instability in the progeny. Here we show that this regulation of COs depends on a disordered and conserved domain within the synaptonemal complex (SC). This domain is located at the C-terminus of the central element protein SYP-4 in Caenorhabditis elegans. While not necessary for synapsis, the C-terminus of SYP-4 is crucial for both CO assurance and interference. Although the SYP-4 C-terminus contains many potential phosphorylation sites, we found that phosphorylation is not the primary regulator of CO events. Instead, we discovered that nine conserved phenylalanines are required to recruit a pro-CO factor predicted to be an E3 ligase and regulate the physical properties of the SC. We propose that this conserved and disordered domain plays a crucial role in maintaining the SC in a state that allows transmitting signals to regulate CO formation. While the underlying mechanisms remain to be fully understood, our findings align with existing models suggesting that the SC plays a critical role in determining the number and distribution of COs along chromosomes, thereby safeguarding the genome for future generations.


Conflict of interest statement

None declared.

Figures

Graphical Abstract
Graphical Abstract
Figure 1.
Figure 1.
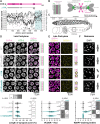
The last 114 amino acids of SYP-4 constitute a conserved domain that is dispensable for synapsis but essential for CO regulation. (A) Both the N- and C-termini of C. elegans SYP-4 are conserved (black). While the N-terminus is predicted to fold into a CC structure, the C-terminus is predicted to be disordered (grey). To test the functionality of this conserved but disordered C-terminal region, we generated the truncated syp-4Δ114 allele using genome editing. Cartoons of SYP-4 are shown on top. (B) Single-molecule localization data predicts the C-terminus of SYP-4 (magenta squares) in the central element of the SC in frontal view (left) and above and below the SC in cross-sectional view (right). Cartoons are based on data from [76] but not drawn to scale. (C) The diagram of a C. elegans germline depicts the progression through the meiotic prophase I stages along the gonad. Images in panels (D) and (E) were acquired in late pachytene, and images in panel (F) were acquired in diakinesis (black boxes). (D) Maximum intensity projections of late pachytene nuclei stained for the HA-tagged SC protein SYP-4 (magenta, left) and the axis protein HTP-3 (green, centre). The merged image is shown on the right. Cartoons illustrate the major finding of complete synapsis across all genotypes with perfect co-localization of axes (green) and SYP-4 (magenta). The time required for synapsis from initiation of synapsis to completion of synapsis is not changed in homozygous syp-4Δ114 or heterozygous balanced syp-4Δ114/skeIR1 animals compared to wild-type (WT) animals (bottom). The vertical dashed line shows the average synapsis zone length in WT animals for comparison. Error bars show mean ± standard deviations. The number of analysed gonads is given as n. P-values were calculated using the Mann–Whitney U test and corrected using the Benjamini–Hochberg method. (E) Maximum intensity projections of late pachytene nuclei stained for SYP-4::HA (magenta) and the Halo-tagged CO marker COSA-1 (yellow). Cartoons highlight that CO interference may be lost or reduced in homozygous and heterozygous syp-4Δ114 animals where some chromosomes acquire more than one COSA-1 focus (stars). The quantification of COSA-1 foci in late pachytene nuclei (bottom) shows an increase in the number of foci in both homozygous syp-4Δ114 and heterozygous balanced syp-4Δ114/skeIR1 animals compared to WT animals. The vertical dashed line at six COSA-1 foci shows the expected number of COSA-1 foci in late pachytene nuclei in WT. Error bars show mean ± standard deviations. The number of nuclei analysed for each genotype is given as n. P-values were calculated using a Gamma–Poisson generalized linear model and corrected using the Benjamini–Hochberg method. (F) Maximum intensity projections of diakinesis nuclei, counterstained with DAPI, show some homolog pairs separating into univalents in syp-4Δ114 animals (cartoons). Quantification is shown at the bottom. The vertical dashed line at 6 DAPI-staining bodies corresponds to the expected number of DAPI-staining bodies per diakinesis nuclei in WT. Error bars show mean ± standard deviations. The number of diakinesis nuclei analysed for each genotype is given as n. P-values were calculated using a Gamma–Poisson generalized linear model and corrected using the Benjamini–Hochberg method.
Figure 2.
Figure 2.
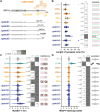
CO interference is attenuated in presence of the syp-4Δ114 allele. (A) The number of COSA-1 foci per SC is tightly regulated to exactly one focus per SC in WT animals. This regulation is lost in syp-4Δ114 animals, which have SCs with multiple or no COSA-1 foci, and reduced in syp-4Δ114/skeIR1 animals, which have SCs with one or two COSA-1 foci. Maximum intensity projections of representative late pachytene nuclei stained for HA-tagged SYP-4 (magenta) and the Halo-tagged COSA-1 (yellow) are shown on the left, individual straightened SCs are shown on the right. The positions of COSA-1 foci along the chromosomes are marked by asterisks (*). (B) Fitting a gamma distribution (solid coloured line) to the cumulative distribution function of normalized inter-COSA-1 distances (circles) in WT (top), syp-4Δ114 (centre), and syp-4Δ114/skeIR1 (bottom) indicated that CO interference is reduced in homozygous and heterozygous syp-4Δ114 animals with a γ shape factor of 2.7 and 10.3, respectively, compared to a γ factor of 42.9 in WT animals. Black lines show fits for no interference (γ = 1, dashed line), and expected wild-type interference (γ = 37, solid line [26]). The number of distances between foci is given by n. (C) CO interference strength is reduced in all syp-4 mutant animals with elevated numbers of COSA-1 foci as quantified by the γ shape factor as shown in panel (B). The number of distances between foci/COs used to assess interference strength are given by n. Error bars show estimated standard errors.
Figure 3.
Figure 3.
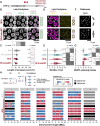
Phosphorylation of the C-terminus of SYP-4 and the last 32 amino acids of SYP-4 modulate CO interference but are dispensable for CO assurance. (A) Diagram of SYP-4 indicating the serine/threonine residues substituted by aspartate residues in SYP-410SD and SYP-45SD phosphomimetic, or by alanine residues in SYP-410SA and SYP-45SA phosphodead mutants (top), and the short internal/terminal deletions within the C-terminus of SYP-4 (bottom). CC corresponds to predicted CC domains. (B) The length of the synapsis zone is unaffected in all SYP-4 phosphomutants and almost all short deletions compared to WT animals but it is extended in syp-4Δpatch3 animals as indicated by the cartoons (right). The vertical dashed line corresponds to the average synapsis zone length observed in WT animals. Error bars show mean ± standard deviations. The number of analysed gonads is given as n. P-values were calculated using the Mann–Whitney U test and corrected using the Benjamini–Hochberg method. (C) The quantification of COSA-1 foci in late pachytene nuclei shows an increase in the number of foci for syp-410SD and syp-45SA phosphomutants, syp-4Δpatch3 and syp-4Δpatch5 animals compared to WT animals. Moreover, the observed increase of COSA-1 foci in syp-4Δpatch5 animals is similar to the increase observed in syp-4Δ114 animals. The vertical dashed line at 6 COSA-1 foci corresponds to the expected number of COSA-1 foci per nucleus in WT. Cartoons depict the likely decrease in interference observed for some of the mutants. Error bars show mean ± standard deviations. The number of nuclei analysed for each genotype is given as n. P-values were calculated using a Gamma–Poisson generalized linear model and corrected using the Benjamini–Hochberg method. (D) Quantification of DAPI-staining bodies in diakinesis nuclei indicates the presence of 6 bivalents in most of the quantified nuclei in phosphomutant, short deletion, and WT animals. Cartoons depict the robust bivalent formation in all mutants. Error bars show mean ± standard deviations. The number of diakinesis nuclei analysed for each genotype is given as n. P-values were calculated using a Gamma–Poisson generalized linear model and corrected using the Benjamini–Hochberg method.
Figure 4.
Figure 4.
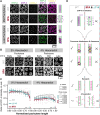
The C-terminus of SYP-4 regulates CO formation via conserved phenylalanine residues. (A) Diagram of SYP-4 indicating the phenylalanine residues substituted by alanine residues in syp-49FA animals. CC corresponds to predicted CC domains. (B) Maximum intensity projections of late pachytene nuclei stained for HA-tagged SYP-4 (magenta, left) and the axis protein HTP-3 (green, centre). The merged image is shown on the right. (C) The synapsis zone length is not altered in homozygous syp-49FA or heterozygous balanced syp-49FA/skeIR1 animals compared to WT animals. The vertical dashed line corresponds to the average synapsis zone length observed in WT animals. Error bars show mean ± standard deviations. n denotes the number of gonads analysed for each genotype. P-values were calculated using the Mann–Whitney U test and corrected using the Benjamini–Hochberg method. (D) Maximum intensity projections of late pachytene nuclei stained for SYP-4::HA (magenta) and the Halo-tagged CO marker COSA-1 (yellow). (E) Quantification of COSA-1 foci in late pachytene nuclei shows an increase in the number of foci in both homozygous syp-49FA and heterozygous balanced syp-49FA/skeIR1 animals compared to WT animals suggesting a semi-dominant effect of the syp-49FA allele. The vertical dashed line at 6 COSA-1 foci shows the expected number of COSA-1 foci in late pachytene nuclei in WT. Error bars show mean ± standard deviations. The number of nuclei analysed for each genotype is given as n. P-values were calculated using a Gamma–Poisson generalized linear model and corrected using the Benjamini–Hochberg method. (F) Maximum intensity projections of diakinesis nuclei counterstained with DAPI. (G) Quantification of DAPI-staining bodies in diakinesis nuclei shows an increase in the number of DAPI-staining bodies in homozygous syp-49FA animals compared to WT indicating the presence of univalents, while the number of DAPI-staining bodies is not increased in heterozygous balanced syp-49FA/skeIR1 animals. Error bars show mean ± standard deviations. The number of diakinesis nuclei analysed for each genotype is given as n. P-values were calculated using a Gamma–Poisson generalized linear model and corrected using the Benjamini–Hochberg method. (H) Genetic mapping of CO sites confirms loss of assurance and interference in syp-49FA animals. A schematic representation of the experimental strategy followed to genetically map CO sites is shown on top. Chromosome tracks show the ratio between Bristol-specific reads and the total number of specific reads along the chromosomes. A ratio of zero (blue) corresponds to homozygous regions derived from the Hawaiian background, whereas a ratio of 0.5 or more (red) corresponds to heterozygous regions containing both Hawaiian- and Bristol-specific sequences. The transition from homozygous (blue) to heterozygous (red) regions corresponds to CO sites (arrow heads). Chromosomes that were found to contain a single copy (haploid, grey) or three copies (triploid, black) based on the average copy number per chromosome were not considered for the detection of CO sites. Recombination scars from the introgression of the skeIR1 balancer on chromosome I of syp-49FA animals are marked by green stars. We sequenced three wild-type and 8 syp-49FA embryos. Note that syp-49FA but not wild-type animals included a HaloTag::cosa-1 allele and a C-terminal HA-tag for syp-4. However, the addition of these tags did not alter the phenotype of WT animals (Supplementary Table S5).
Figure 5.
Figure 5.
The defects in CO regulation in syp-49FA and syp-4Δ114 animals are accompanied by a mislocalization of ZHP-3 and changes in the biophysical properties of the SC. (A) Maximum intensity projections of mid and late pachytene nuclei stained for HTP-3 (green), V5-tagged ZHP-3 (magenta), and Halo-tagged COSA-1 (yellow) show that the co-localization of ZHP-3 and SCs is lost in syp-49FA animals. However, ZHP-3 co-localizes with COSA-1 in both wild-type and syp-49FA animals in late pachytene. Merged images are shown on the right. Nuclei are encircled with a dashed line. (B) Maximum intensity projections of early, mid, and late pachytene nuclei from extruded gonads treated with 0% (w/v) or 4% (w/v) 1,6-hexanediol and stained for SYP-4::HA. (C) SCs in syp-49FA and syp-4Δ114 animals are more sensitive to 1,6-hexanediol than SCs of WT animals. The ratio between the total SYP-4 intensity on the axes and the total SYP-4 intensity within the nucleus in WT (grey), syp-49FA (red), and syp-4Δ114 (cyan) are shown across the pachytene region divided into 11 bins. In untreated pachytene nuclei, the majority of SYP-4 signal is found on the axis (axis/nucleus ratio > 0.5), while SYP-4 is more nucleoplasmic in presence of 4% (w/v) 1,6-hexanediol. The loss of SYP-4 on the axis in presence of hexanediol is higher in syp-49FA (P-value = 0.011) and syp-4Δ114 animals (P-value = 0.025). Error bars show mean ± standard error, and n denotes the number of gonads analysed. P-values were calculated using a linear mixed model accounting for variations between genotypes and random variations between gonads from different animals (see the ‘Materials and methods’). (D) Diagram summarizing the role of nine conserved phenylalanine residues within the C-terminus of SYP-4 in ZHP-3 localization (top) and SC stability (bottom) to regulate crossing-over (centre).

References

    1. Hassold T, Hunt P To err (meiotically) is human: the genesis of human aneuploidy. Nat Rev Genet. 2001; 2:280–91.10.1038/35066065. - DOI - PubMed
    1. Nagaoka SI, Hassold TJ, Hunt PA Human aneuploidy: mechanisms and new insights into an age-old problem. Nat Rev Genet. 2012; 13:493–504.10.1038/nrg3245. - DOI - PMC - PubMed
    1. Maguire MP The need for a chiasma binder. J Theor Biol. 1974; 48:485–7.10.1016/S0022-5193(74)80017-2. - DOI - PubMed
    1. Zickler D, Kleckner N Meiotic chromosomes: integrating structure and function. Annu Rev Genet. 1999; 33:603–754.10.1146/annurev.genet.33.1.603. - DOI - PubMed
    1. Zickler D, Kleckner N Recombination, pairing, and synapsis of homologs during meiosis. Cold Spring Harb Perspect Biol. 2015; 7:a016626.10.1101/cshperspect.a016626. - DOI - PMC - PubMed

MeSH terms

Substances

LinkOut - more resources