. 2025 Feb 25;122(8):e2416578122.
doi: 10.1073/pnas.2416578122. Epub 2025 Feb 18.

ATP-sensitive potassium channels alter glycolytic flux to modulate cortical activity and sleep

Affiliations

ATP-sensitive potassium channels alter glycolytic flux to modulate cortical activity and sleep

Nicholas J Constantino et al. Proc Natl Acad Sci U S A. .

Abstract

Metabolism plays a key role in the maintenance of sleep/wake states. Brain lactate fluctuations are a biomarker of sleep/wake transitions, where increased interstitial fluid (ISF) lactate levels are associated with wakefulness and decreased ISF lactate is required for sleep. ATP-sensitive potassium (KATP) channels couple glucose-lactate metabolism with excitability. Using mice lacking KATP channel activity (e.g., Kir6.2-/- mice), we explored how changes in glucose utilization affect cortical electroencephalography (EEG) activity and sleep/wake homeostasis. In the brain, Kir6.2-/- mice shunt glucose toward glycolysis, reducing neurotransmitter biosynthesis and dampening cortical EEG activity. Kir6.2-/- mice spent more time awake at the onset of the light period due to altered ISF lactate dynamics. Together, we show that Kir6.2-KATP channels act as metabolic sensors to gate arousal by maintaining the metabolic stability of sleep/wake states and providing the metabolic flexibility to transition between states.

Keywords: KATP channels; arousal; excitability; metabolism; sleep.


Conflict of interest statement

Competing interests statement:The authors declare no competing interest.

Figures
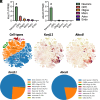
Fig. 1.
Fig. 1.
Kir6.2-KATP channels are expressed on excitatory and inhibitory neurons within the mouse brain. (A) Expression of Kir6.2-KATP channel subunits within the brain (Kcnj11 and Abcc8) (brainrnaseq.org). Kcnj11 and Abcc8 are primarily expressed on neurons, not glia or vascular cells (P < 0.0001, one-way ANOVA). (B) UMAP plot of cell type designations, Kcnj11 expression, and Abcc8 expression (portal.brain-map.org/atlases-and-data/bkp/abc-atlas). Expression was predominantly localized to glutamatergic and GABAergic neurons. (C) Pie chart of percentage of transcripts of Kcnj11 and Abcc8 in each cell type (portal.brain-map.org/atlases-and-data/bkp/abc-atlas). Data reported as ± SEM. n = 2 mice in brainrnaseq.org. # = P < 0.0001.
Fig. 2.
Fig. 2.
Kir6.2−/− brains shunt glucose toward glycolysis and away from neurotransmitter synthesis, despite normal synaptic and nonsynaptic mitochondrial respiration. (A) Heatmap of metabolites following 13C-glucose administration. (B) Incorporation of 13C-glucose into metabolic pathways. Kir6.2−/− mice shunt glucose toward glycolysis and away from neurotransmitter synthesis (P < 0.0001 and P = 0.0003, two-way ANOVA). (C and D) Unlabeled pyruvate is reduced, while fully labeled pyruvate and lactate are increased in Kir6.2−/− mice (P < 0.01, P < 0.05, two-way ANOVA). (EG) TCA intermediates citrate, fumarate, and malate are unaltered in Kir6.2−/− mice (P > 0.1, two-way ANOVA). (HJ) Labeled glutamine, pyroglutamic acid, and GABA are reduced in Kir6.2−/− mice (P < 0.05, two-way ANOVA), while unlabeled metabolites are elevated (P < 0.05, two-way ANOVA). (K) Glutamate is unaltered (P > 0.1, two-way ANOVA). (L) Labeled glycine is increased in Kir6.2−/− mice (P < 0.05, two-way ANOVA), while unlabeled glycine is decreased (P < 0.05, two-way ANOVA). (M) Nonsynaptic mitochondrial oxygen consumption rates (OCR) are unchanged in Kir6.2−/− mice (P > 0.1, unpaired t tests). (N) Synaptic mitochondrial OCR are unchanged in Kir6.2−/− mice (P > 0.1, unpaired t tests). Data reported as ± SEM. n = 6 to 9 mice/genotype (SI Appendix, Fig. S1).
Fig. 3.
Fig. 3.
Reductions in cortical EEG power across sleep/wake states are reflected in changes in arousal, anxiety, and cognition. (AC) Cortical EEG absolute power is decreased across wake, NREM, and REM in Kir6.2−/− mice (P < 0.0001, two-way ANOVA). (D) In wake, absolute theta and alpha power are decreased in Kir6.2−/− mice (P < 0.0001, two-way ANOVA). (E and F) In NREM and REM, absolute theta power is reduced in Kir6.2−/− mice (P < 0.0063, P < 0.0001, two-way ANOVA). (G) During anesthesia challenges, induction and emergence time were increased in Kir6.2−/− mice (P < 0.05, P = 0.0904, unpaired t test). (H) Kir6.2−/− mice have reduced acoustic startle (P = 0.0754, unpaired t test). (I) Decreased latency to explore a novel environment in Kir6.2−/− mice (P < 0.01, unpaired t test). (J) Activity is unaltered in Kir6.2−/− mice, while distance traveled in the center of the chamber is elevated (P = 0.0698, unpaired t test). (K) Relative theta:gamma ratio is decreased in Kir6.2−/− mice across states (P < 0.01, P < 0.0001, unpaired t test). (L) Kir6.2−/− mice learned the Morris water maze (MWM) task, but spent less time in the target quadrant (P = 0.0617, unpaired t test). Data reported as means ± SEM. n = 8 to 11 mice/genotype for EEG/EMG, n = 10 to 20 mice/genotype for behavior.
Fig. 4.
Fig. 4.
Kir6.2−/− mice have reduced sleep time and a relative shift in EEG power from theta to gamma across sleep/wake states. (AC) Kir6.2−/− mice have increased wake, decreased NREM, and decreased REM sleep at ZT3 (P < 0.05, two-way ANOVA). Kir6.2−/− mice also have increased REM at ZT17 (P < 0.05). (D) Kir6.2−/− mice lose theta and alpha power and gain delta and gamma power during wake (P < 0.05, two-way ANOVA). (E) Kir6.2−/− mice lose theta and gain gamma power during NREM (P < 0.01, P < 0.001, two-way ANOVA). (F) Kir6.2−/− lose theta power and gain delta, beta, and gamma power during REM (P < 0.05, P < 0.05, P < 0.05, P < 0.0001, two-way ANOVA). (G) Summary table. (H) Kcnj11 and Abcc8 genes are rhythmic over 24-h day (P = 0.0018, P = 0.0008, RAIN). Data reported as means ± SEM. n = 8 to 11 mice/genotype for EEG analysis, n = 2 mice for gene rhythmicity.
Fig. 5.
Fig. 5.
Peripheral metabolic rhythms mirror ISF lactate rhythms in Kir6.2−/− mice. (A) Schematic of EEG/EMG/biosensor implants. (B) ISF lactate fluctuations are lost during NREM to wake and wake to NREM transitions in Kir6.2−/− mice (P < 0.05, two-way ANOVA). (C) ISF lactate is positively correlated with increases in time spent in wake and negatively correlated with time spent in NREM and REM sleep in both Kir6.2−/− and WT mice (Pearson’s R correlation). (D) ISF glucose is positively correlated with time spent in wake and negatively correlated with time spent in NREM and REM sleep in WT mice, but this relationship is lost in Kir6.2−/− mice (Pearson’s R correlation). (E) Glucose challenge increases ISF glucose in Kir6.2−/− mice (P < 0.0001, one-way ANOVA, unpaired t test). (F) Glucose challenge does not increase in ISF lactate in Kir6.2−/− mice (one-way ANOVA, unpaired t test). (G) A glucose challenge does not increase time in wake in Kir6.2−/− mice. (H) The rise in ISF lactate preceding the light–dark switch is delayed in the Kir6.2−/− (P < 0.05, two-way ANOVA). ISF lactate rhythms show decreased amplitude and a phase shift in Kir6.2−/− mice (P < 0.05, P < 0.001, unpaired t test). (I) The peak in ISF glucose levels is increased in Kir6.2−/− mice at ZT19-20 compared to WT (P < 0.05, unpaired t test). (J) Total energy expenditure (TEE) rhythms are phase shifted in Kir6.2−/− mice v WT (P < 0.05, unpaired t test). (K) Respiratory exchange ratio (RER) rhythms have decreased amplitude and a phase shift in Kir6.2−/− mice (P < 0.05, unpaired t test). Data reported as means ± SEM. ISF lactate, ISF glucose, and sleep/wake transitions (n = 8 to 18 mice/genotype). Correlations n = 8 to 11 mice/genotype, TEE and RER n = 5 mice/genotype.

Update of

References

    1. Aalling N. N., Nedergaard M., DiNuzzo M., Cerebral metabolic changes during sleep. Curr. Neurol. Neurosci. Rep. 18, 57 (2018). - PMC - PubMed
    1. DiNuzzo M., Nedergaard M., Brain energetics during the sleep-wake cycle. Curr. Opin. Neurobiol. 47, 65–72 (2017). - PMC - PubMed
    1. Rempe M. J., Wisor J. P., Cerebral lactate dynamics across sleep/wake cycles. Front. Comput. Neurosci. 8, 174 (2014). - PMC - PubMed
    1. Constantino N. J., et al. , Kir6.2-K (ATP) channels alter glycolytic flux to modulate cortical activity, arousal, and sleep-wake homeostasis. bioRxiv [Preprint] (2024). https://www.biorxiv.org/content/10.1101/2024.02.23.581817 (Accessed 28 February 2024). - DOI
    1. Naylor E., et al. , Lactate as a biomarker for sleep. Sleep 35, 1209–1222 (2012). - PMC - PubMed

LinkOut - more resources