. 2025 Feb 18;135(8):e176631.
doi: 10.1172/JCI176631. eCollection 2025 Apr 15.

Aberrant ERK signaling in astrocytes impairs learning and memory in RASopathy-associated BRAF mutant mouse models

Affiliations

Aberrant ERK signaling in astrocytes impairs learning and memory in RASopathy-associated BRAF mutant mouse models

Minkyung Kang et al. J Clin Invest. .

Abstract

RAS/MAPK pathway mutations often induce RASopathies with overlapping features, such as craniofacial dysmorphology, cardiovascular defects, dermatologic abnormalities, and intellectual disabilities. Although B-Raf proto-oncogene (BRAF) mutations are associated with cardio-facio-cutaneous (CFC) syndrome and Noonan syndrome, it remains unclear how these mutations impair cognition. Here, we investigated the underlying neural mechanisms using several mouse models harboring a gain-of-function BRAF mutation (K499E) discovered in RASopathy patients. We found expressing BRAF K499E (KE) in neural stem cells under the control of a Nestin-Cre promoter (Nestin;BRAFKE/+) induced hippocampal memory deficits, but expressing it in excitatory or inhibitory neurons did not. BRAF KE expression in neural stem cells led to aberrant reactive astrogliosis, increased astrocytic Ca2+ fluctuations, and reduced hippocampal long-term depression (LTD) in mice. Consistently, 3D human cortical spheroids expressing BRAF KE also showed reactive astrogliosis. Astrocyte-specific adeno-associated virus-BRAF KE (AAV-BRAF KE) delivery induced memory deficits and reactive astrogliosis and increased astrocytic Ca2+ fluctuations. Notably, reducing extracellular signal-regulated kinase (ERK) activity in astrocytes rescued the memory deficits and altered astrocytic Ca2+ activity of Nestin;BRAFKE/+ mice. Furthermore, reducing astrocyte Ca2+ activity rescued the spatial memory impairments of BRAF KE-expressing mice. Our results demonstrate that ERK hyperactivity contributes to astrocyte dysfunction associated with Ca2+ dysregulation, leading to the memory deficits of BRAF-associated RASopathies.

Keywords: Development; Genetic diseases; Intellectual disability; Neurodevelopment; Neuroscience.


Figures

Figure 1
Figure 1. BRAF KE in neural stem cells causes learning deficits and impairs hippocampal LTD.
(A) Breeding strategy. (B) Illustration of the hidden-platform version of the MWM. (C) Latency to find the platform during the MWM training trials. (D) Representative trajectories of mice in C in the MWM probe trial. The platform position during the training trials is indicated by a red circle. (E) Quadrant occupancy or (F) proximity to the platform of the mice in D. T, target; R, right; L, left; O, opposite. (G) Latency to find the platform during the MWM training trials. (H) Representative trajectories of mice in G in the probe trial. (I) Quadrant occupancy or (J) proximity to the platform of the mice in H. (K) Schematic of the OPR test. (L and M) Percentage of time exploring the relocated object in the OPR test for control or (L) αCaMKII;BRAFKE/+, or (M) vGAT;BRAFKE/+ mice. (N) Latency to find the platform during the MWM training trials. (O) Representative trajectories of mice in N in the MWM probe trial. (P) Quadrant occupancy or (Q) proximity to the platform of the mice in O. (R) Percentage of time exploring the relocated object in the OPR test for control or Nestin;BRAFKE/+ mice. (S) Schematic showing the slice stimulation/recording configuration. (T) LTP induced by HFS. Traces represent the average fEPSP at baseline (–15 to 0 minutes) and after LTP induction (51 to 60 minutes). Vertical bar, 0.5 mV; horizontal bar, 10 ms. (U) LTD induced by LFS. Traces represent the average fEPSP at baseline (–15 to 0 minutes) and after LTD induction (51 to 60 minutes). Vertical bar, 1 mV; horizontal bar, 5 ms. (V) The average fEPSP slope from 51 to 60 minutes after LTD induction. Data are expressed as means ± SEM. *P < 0.05; **P < 0.01; ***P < 0.001; ****P < 0.0001.
Figure 2
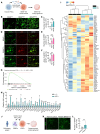
Figure 2. Nestin;BRAFKE/+ mice exhibit reactive astrogliosis in the hippocampus.
(A) Representative images of GFAP (green) and NeuN (red) immunolabeling in the hippocampal CA1 region of adult BRAF+/+ and Nestin;BRAFKE/+ mice. Scale bars: 50 μm. (B) Relative area of GFAP-expressing cells from mice in A. (C) Number of NeuN-positive cells from mice in A. (D) Representative confocal images of S100β (red) and GFAP (green) immunolabeling in the hippocampal CA1 region of adult BRAF+/+ and Nestin;BRAFKE/+ mice. Scale bars: 50 μm; 10 μm (zoomed in image). (E and F) Relative density of (E) S100β-expressing cells or (F) GFAP-expressing cells in the hippocampi from BRAF+/+ or Nestin;BRAFKE/+ mice. (G) Representative image for a Sholl analysis of an astrocyte in the stratum radiatum of the GFAP-stained image in D. (H) The number of process intersections and (I) the sum of the process intersections of GFAP-positive astrocytes in the stratum radiatum of BRAF+/+ or Nestin;BRAFKE/+ mice. (J) Plot showing enrichment of reactive astrocyte gene sets. (K) Relative fold change of reactive astrocyte genes in the comparison of BRAF+/+ and Nestin;BRAFKE/+ transcriptomes. (L) Hierarchical clustering heatmap with the expression levels of reactive astrocyte genes represented in colors mapped to log2-transformed FPKM plus 1. FPKM, fragments per kilobase of transcript per million mapped reads. Data are expressed as means ± SEM. *P < 0.05; **P < 0.01; ***P < 0.001; ****P < 0.0001.
Figure 3
Figure 3. BRAF KE activates RAS/ERK signaling in astrocytes and induces reactive astrogliosis in human cortical spheroids.
(A) Schematic diagram of the experimental design. (B) Representative 3D surface renderings of GFAP-positive cells in BRAF+/+, BRAFKE/+, and BRAFKE/KE human cortical spheroids at day 372. Scale bars: 10 μm. (C) Quantification of the number of GFAP-positive voxels in human cortical spheroids in B. (D) Representative images of p-ERK1/2 (red) and GFAP (green) immunostaining in BRAF+/+, BRAFKE/+, and BRAFKE/KE human cortical spheroids at day 292. Scale bars: 10 μm. (E and F) Quantification of (E) the number of p-ERK1/2-positive pixels (area) and (F) percentage of the p-ERK1/2-positive area out of the GFAP-positive area in human cortical spheroids in D. (G) Plot showing enrichment of reactive astrocyte gene sets. (H) Relative fold changes in the expression of reactive astrocyte genes in the comparison between the BRAF+/+ and BRAFKE/+ transcriptomes. (I) Hierarchical clustering heatmap showing the expression of reactive astrocyte gene colors mapped to log2-transformed FPKM plus 1. (J) Schematic diagram of the experimental design. (K) Representative images of GFAP immunolabeling of human cortical spheroids at day 372. iPSC lines were generated from a RASopathy patient with the BRAFKE/+ mutation and from an age/sex-matched normal subject. These lines were then differentiated into 3D cortical spheroids. Scale bars: 20 μm. (L) Quantification of GFAP-positive pixels in cortical spheroids from normal control and RASopathy patient. Data are expressed as means ± SEM. *P < 0.05; **P < 0.01; ***P < 0.001.
Figure 4
Figure 4. Astrocyte-specific BRAF KE induces reactive astrogliosis and hippocampal memory deficits.
(A) Schematic illustrating the experimental approach. AAV5-GFAP-GFP (GFP) or AAV5–GFAP–HA–BRAF KE (BRAF KE) was injected into the hippocampal CA1 region of adult C57BL/6 mice. (B) Latency for mice injected with GFP or BRAF KE to find the hidden-platform during MWM training trials. (C) Representative trajectories of GFP- or BRAF KE–injected mice during the MWM probe trial. (D) Quadrant occupancy, (E) proximity to the platform, or (F) number of target zone entries of the mice in C. (G) Representative immunohistochemical images from GFP- or BRAF KE–injected mice. Slices were immunostained for HA (green), GFAP (magenta), and p-ERK1/2 (red). Arrows indicate double labeling of GFAP and p-ERK1/2. Scale bars: 50 μm. (H) GFAP-expressing cells from the mice in G. (I) Representative Sholl analyses of an astrocyte in the stratum radiatum of the GFAP-stained image in G. (J) The number of process intersections and (K) the sum of process intersections for GFAP-positive astrocytes in the stratum radiatum of GFP- or BRAF KE–injected mice. (L) Representative immunoblot image of hippocampal lysates from mice injected with GFP or BRAF KE. (M) p-ERK1/2 expression normalized to ERK1/2 expression in hippocampal lysates or (N) GFAP expression normalized to GAPDH expression from the mice in L. Data are expressed as means ± SEM. *P < 0.05; **P < 0.01; ***P < 0.001; ****P < 0.0001.
Figure 5
Figure 5. BRAF KE–induced hyperactive calcium fluctuations in hippocampal astrocytes are dependent on RAS/ERK signaling.
(A) Schematic illustrating the experimental approach. The hippocampal CA1 regions of adult C57BL/6 WT mice were injected with AAV-GFAP-HA-BRAF WT (WT) or AAV–GFAP–HA–BRAF KE (KE), and GFAP-HA-dnMEK1 (dnMEK1) or saline, and AAV-gfaABC1D-GCaMP6f. (B) Representative Western blot of p-ERK1/2, ERK1/2, GFAP, and GAPDH expression in hippocampal lysates from mice injected as in A. (C) p-ERK1/2 expression normalized to ERK1/2 expression or (D) GFAP expression normalized to GAPDH expression in mice treated as in A. (E) Representative images of Ca2+ fluctuations measured in hippocampal astrocytes from BRAF WT or BRAF KE mice injected with saline or dnMEK1. The yellow squares indicate each ROI. (F) Representative GCaMP fluorescent traces from the astrocytes in E. Scale bars: 20 arbitrary units and 1 minute. (G) Relative total area under the curve per ROI during a 5-minute recording from the mice in E. Data are expressed as means ± SEM. ***P < 0.001; ****P < 0.0001.
Figure 6
Figure 6. Astrocyte-specific expression of a dominant-negative MEK1 mutant rescues hyperactive astroglial Ca2+ fluctuations and hippocampal memory deficits in Nestin;BRAFKE/+ mice.
(A) Schematic illustrating the experimental approach. GFAP-HA-dnMEK1 (dnMEK1) and gfaABC1D-GCaMP6f (GCaMP6f) virus were injected into the hippocampal CA1 region of adult BRAF+/+ (WT) and Nestin;BRAFKE/+ (Nestin-KE) mice. (B) Representative Western blot showing p-ERK1/2 and ERK1/2 expression in hippocampal lysates from BRAF+/+ or Nestin;BRAFKE/+ mice treated as in A. (C) Quantification of p-ERK1/2 expression normalized to ERK1/2 expression in samples from B. (D) Representative images of Ca2+ fluctuations measured in hippocampal astrocytes from BRAF+/+ and Nestin;BRAFKE/+ mice treated as in A. The yellow squares indicate each ROI. (E) Representative traces from astrocytes in D. Scale bars: 20 arbitrary units and 1 minute. (F) Relative total area under the curve per ROI during a 5-minute recording from the mice in E. (GJ) For MWM, GFAP-control (mCherry or GFP; control) or GFAP-HA-dnMEK1 (dnMEK1) virus was injected into the hippocampal CA1 region of BRAF+/+ (WT) and Nestin;BRAFKE/+ (Nestin-KE) mice. (G) Representative trajectories of BRAF+/+ and Nestin;BRAFKE/+ mice injected with GFAP-control or GFAP-HA-dnMEK1 during the MWM probe trial. (H) Quadrant occupancy, (I) proximity to the platform, or (J) number of target zone entries of the mice in G. Data are expressed as means ± SEM. *P < 0.05; **P < 0.01; ***P < 0.001; ****P < 0.0001.
Figure 7
Figure 7. Astrocyte-specific expression of hPMCA2w/b attenuates the hyperactive astroglial Ca2+ fluctuations and hippocampal memory deficits of BRAF KE–injected mice.
(A) Schematic illustrating the experimental approach. AAV-GFAP-HA-BRAF WT (WT) or AAV-GFAP–HA–BRAF KE (KE), gfaABC1D-hPMCA2w/b (hPMCA2w/b) or gfaABC1D-Tomato (Tomato), and AAV-gfaABC1D-GCaMP6f were injected into the hippocampal CA1 region of adult C57BL/6 WT mice. (B) Representative Western blot showing p-ERK1/2, ERK1/2, GFAP, and GAPDH expression in hippocampal lysates from the mice injected in A. (C) p-ERK1/2 expression normalized to ERK1/2 expression or (D) GFAP expression normalized to GAPDH expression in the mice injected in A. (E) Representative images showing colocalization of hPMCA2w/b (red) and HA (green) in GFAP-expressing astrocytes. Scale bars: 10 μm. (F and G) Ca2+ fluctuations in astrocytes of hippocampal slices from BRAF WT or BRAF KE mice injected with Tomato or hPMCA2w/b. (F) Representative GCaMP fluorescence traces recorded in astrocytes. Scale bars: 40 arbitrary units and 1 minute. (G) Relative total area under the curve per ROI during a 5-minute recording. (HK) For the MWM experiments, Tomato or hPMCA2w/b virus was injected into the hippocampal CA1 region of BRAF WT or BRAF KE mice. (H) Representative trajectories of WT or KE mice injected with Tomato or hPMCA2w/b in the MWM probe trial. (I) Quadrant occupancy, (J) proximity to the platform, or (K) number of target zone entries of the mice in H. Data are expressed as means ± SEM. *P < 0.05; **P < 0.01; ****P < 0.0001.

References

    1. Kolch W. Meaningful relationships: the regulation of the Ras/Raf/MEK/ERK pathway by protein interactions. Biochem J. 2000;351(pt 2):289–305. - PMC - PubMed
    1. Boguski MS, McCormick F. Proteins regulating Ras and its relatives. Nature. 1993;366(6456):643–654. doi: 10.1038/366643a0. - DOI - PubMed
    1. Ryu HH, Lee YS. Cell type-specific roles of RAS-MAPK signaling in learning and memory: implications in neurodevelopmental disorders. Neurobiol Learn Mem. 2016;135:13–21. doi: 10.1016/j.nlm.2016.06.006. - DOI - PubMed
    1. Shilyansky C, et al. Molecular and cellular mechanisms of learning disabilities: a focus on NF1. Annu Rev Neurosci. 2010;33:221–243. - PMC - PubMed
    1. Kim YE, Baek ST. Neurodevelopmental aspects of RASopathies. Mol Cells. 2019;42(6):441–447. doi: 10.14348/molcells.2019.0037. - DOI - PMC - PubMed

MeSH terms

Supplementary concepts