. 2025 Feb 18;10(6):e185946.
doi: 10.1172/jci.insight.185946.

Mitochondrial defects and metabolic vulnerabilities in Lynch syndrome-associated MSH2-deficient endometrial cancer

Affiliations

Mitochondrial defects and metabolic vulnerabilities in Lynch syndrome-associated MSH2-deficient endometrial cancer

Mikayla Borthwick Bowen et al. JCI Insight. .

Abstract

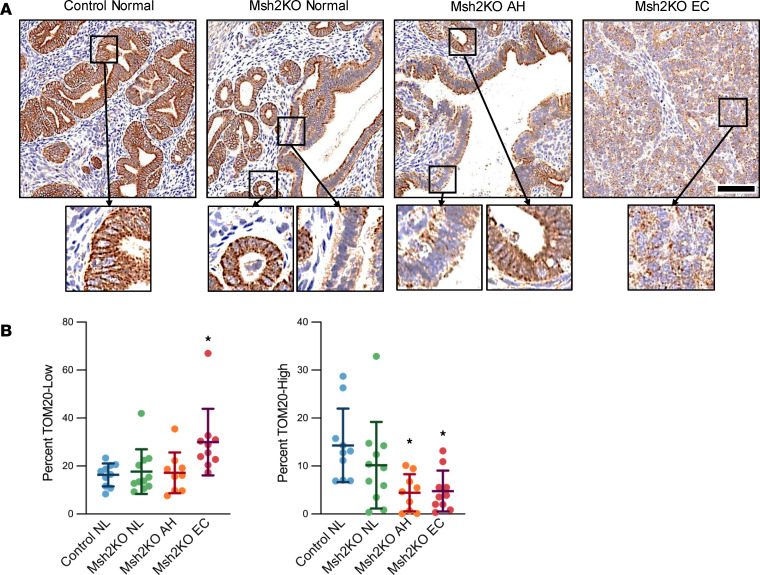
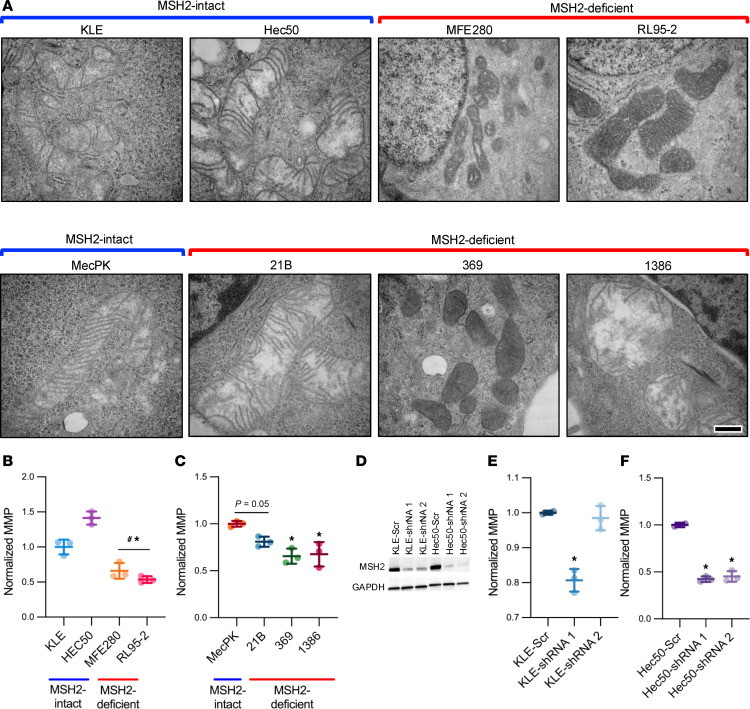
Lynch syndrome (LS), caused by inherited mutations in DNA mismatch repair genes, including MSH2, carries a 60% lifetime risk of developing endometrial cancer (EC). Beyond hypermutability, mechanisms driving LS-associated EC (LS-EC) remain unclear. We investigated MSH2 loss in EC pathogenesis using a mouse model (PR-Cre Msh2LoxP/LoxP, abbreviated Msh2KO), primary cell lines, human tissues, and human EC cells with isogenic MSH2 knockdown. By 8 months, 58% of Msh2KO mice developed endometrial atypical hyperplasia (AH), a precancerous lesion. At 12-16 months, 50% of Msh2KO mice exhibited either AH or ECs with histologic similarities to human LS-ECs. Transcriptomic profiling of EC from Msh2KO mice revealed mitochondrial dysfunction-related pathway changes. Subsequent studies in vitro and in vivo revealed mitochondrial dysfunction based on 2 mechanisms: mitochondrial content reduction and structural disruptions in retained mitochondria. Human LS-ECs also exhibited mitochondrial content reduction compared with non-LS-ECs. Functional studies demonstrated metabolic reprogramming of MSH2-deficient EC, including reduced oxidative phosphorylation and increased susceptibility to glycolysis suppression. These findings identified mitochondrial dysfunction and metabolic disruption as consequences of MSH2 deficiency in EC. Mitochondrial and metabolic aberrations should be evaluated as biomarkers for endometrial carcinogenesis or risk stratification and represent potential targets for cancer interception in women with LS.

Keywords: Cancer; Cell biology; Mitochondria; Obstetrics/gynecology; Oncology.


Conflict of interest statement

Conflict of interest: The authors have declared that no conflict of interest exists.

Figures

Figure 1
Figure 1. Characterization of mouse model for MSH2-deficient EC development.
(A) Msh2KO mice express PR-Cre and a floxed Msh2 gene segment. (B) Presence of MSH2 by immunohistochemistry (IHC) in control mouse endometrium (left) and Msh2KO mouse endometrium (right). Scale bar: 200 μm. (C) Representative images of H&E-stained uterine tissues from Msh2KO mice with benign endometrium, Msh2KO mice with AH, and Msh2KO mice with uterine tumors with endometrioid-like and serous-like histology. Scale bar: 200 μm. (D) Top 10 dysregulated pathways in Msh2KO EC (left, n = 7) or Msh2KO benign endometrium (right, n = 6) versus control benign endometrium (n = 4) identified by Ingenuity Pathway Analysis (IPA), which uses right-tailed Fisher’s exact tests using differentially expressed genes identified using the Transcriptome Analysis Console (ANOVA with eBayes analysis correction) from ClariomD microarray transcriptome analyses.
Figure 2
Figure 2. Mitochondrial content decreased during Msh2KO EC development.
(A) Representative images (original magnification, ×20) of TOM20-stained control normal endometrium (n = 10 total analyzed), Msh2KO normal endometrium (n = 11 total analyzed), Msh2KO AH (n = 9 total analyzed), and Msh2KO EC (n = 10 total analyzed) IHC specimens. Scale bar: 100 μm. Insets, ×40 magnification. Staining of glandular areas was quantified using ImageScope Cytoplasmic algorithm. (B) Percentage cells with low (left) and high (right) TOM20 staining. Data are mean ± SD. Data points are values from individual mice. Analysis was by ANOVA with Dunnett’s multiple-comparison test. *P < 0.01 compared with control normal (NL) endometrium.
Figure 3
Figure 3. MSH2-deficient EC exhibited mitochondrial content reduction.
(A) Representative images of TOM20-stained human non-MMRd EC (left, n = 22 total analyzed) and MSH2-deficient EC (right, n = 13 total analyzed) by IHC. Scale bar: 100 μm. Staining was quantified using ImageScope Cytoplasmic algorithm. (B) Percentage cells with high (left) and low (right) TOM20 staining. Data are mean ± SD. Data points are values from individual patient samples. Analysis was by Mann-Whitney U test. *P < 0.05 compared with non-MMRd. (C) Mouse and human (D) EC cell lines were stained using immunofluorescence for TOM20 (green) and HCS CellMask (red) and counterstained with Hoechst 33342. Representative Z-stacked Airyscan-processed maximum intensity projection images shown. Scale bars: 10 μm. Mitochondrial content (TOM20 intensity) corrected for cell area (HCS CellMask) was quantified using CellProfiler for mouse (E) and human (F) EC cell lines. For immunofluorescence studies, each cell line had n = 3 technical replicates. Data are mean ± SEM. Data points are values from individual cells. Analysis was by ANOVA with Dunnett’s multiple-comparison test. (E) *P < 0.01 relative to MecPK. (F) #P < 0.0001 relative to KLE; *P < 0.05 relative to Hec50.
Figure 4
Figure 4. MSH2-deficient EC cells exhibit defects in mitochondrial integrity.
(A) Transmission electron microscopy was performed on human (top row) and mouse (bottom row) MSH2-intact and MSH2-deficient EC cell lines. Scale bar: 200 nm. Mitochondrial membrane potential (MMP) was measured using flow cytometric analysis of JC-1–stained human (B) and mouse (C) EC cells (n = 3 technical replicates for all cell lines). Data are mean ± SD. Data points are values from individual samples. Analysis was by ANOVA with Dunnett’s multiple-comparison test. (B) *P < 0.05 relative to KLE; #P < 0.05 relative to Hec50. (C) *P < 0.05 relative to MecPK. (D) Western blot of MSH2 expression (GAPDH loading control) showing lentiviral shRNA-mediated MSH2 knockdown was achieved in KLE and Hec50 cells using shRNA1 and shRNA2 sequences. MMP was measured using flow cytometric analysis of JC-1–stained KLE (E) and Hec50 (F) cells with (shRNA1, shRNA2) and without (Scr) MSH2 knockdown (n = 3 technical replicates for all cell lines). Data are mean ± SD. Data points are values from individual samples. Analysis was by ANOVA with Dunnett’s multiple-comparison test. (E) *P < 0.01 relative to KLE-Scr. (F) *P < 0.0001 relative to Hec50-Scr.
Figure 5
Figure 5. MSH2 loss conferred reduced mitochondrial function in EC cells.
Mitochondrial stress tests were performed on mouse (A and B) and human (C and D) EC cells, as well as on isogenic KLE (E and F) and Hec50 (G and H) cells with and without lentiviral shRNA-mediated MSH2 knockdown. Oxygen consumption rate (OCR) was measured during mitochondrial targeting. Basal OCR (baseline OCR – oligomycin OCR) was calculated for each cell line. Spare respiratory capacity (SRC) (FCCP OCR – baseline OCR) was calculated for each cell line. n = 5 replicates per line. Data are mean ± SD. Data points are values from individual samples. Analysis was by ANOVA with Dunnett’s multiple-comparison test. (A and B) *P < 0.0001 relative to MecPK. (C and D) *P < 0.05 relative to KLE; #P < 0.05 relative to Hec50. (EH) *P < 0.05 relative to Scr controls.
Figure 6
Figure 6. Metabolites indicative of TCA cycle dysfunction were elevated in Msh2KO EC.
(A) Schematic overview of metabolites related to TCA cycle entry (pyruvate, lactate, citrate) and premature exit from the TCA cycle (derivatives of TCA cycle intermediates). (B) Quantification of relative peak metabolite abundance of those related to TCA cycle entry (pyruvate, lactate, and citrate) between Msh2KO normal endometrium (blue, n = 13) and Msh2KO EC (red, n = 7) tissues using IC-MS polar metabolomics profiling. (C) Quantification of relative peak metabolite abundance of derivatives of TCA cycle intermediates (mesaconic acid, itaconate, maleic acid, orotic acid, galacturonic acid, 2-hydroxyglutaric acid, 3-hydroxymethylglutaric acid) in Msh2KO normal endometrium (blue) and Msh2KO EC (red) tissues using IC-MS polar metabolomics profiling. Ben, benign; Tum, tumor. Data are mean ± SEM. Data points are values from individual mice. Analysis was by ANOVA with FDR-corrected P values reported in each graph.
Figure 7
Figure 7. MSH2-deficient EC cells are highly vulnerable to metabolic targeting.
MSH2-intact and -deficient murine and human EC cells were treated with glucose-free media supplemented with 4.5 g/L galactose for 72 hours. Viability was measured using CellTiter Glo. Viability relative to glucose-containing media (4.5 g/L) controls are shown. n = 3 replicates for each cell line. Data are mean ± SD. Data points are values from individual samples. Analysis was by ANOVA with Dunnett’s multiple-comparisons test. *P < 0.0001 relative to MecPK; #P < 0.05 relative to KLE; +P < 0.0001 relative to Hec50.

Update of

References

    1. Win AK, et al. Prevalence and penetrance of major genes and polygenes for colorectal cancer. Cancer Epidemiol Biomarkers Prev. 2017;26(3):404–412. doi: 10.1158/1055-9965.EPI-16-0693. - DOI - PMC - PubMed
    1. Idos G, Valle L, eds. Lynch Syndrome. University of Washington; 1993.
    1. Gruber SB, Thompson WD. A population-based study of endometrial cancer and familial risk in younger women. Cancer and Steroid Hormone Study Group. Cancer Epidemiol Biomarkers Prev. 1996;5(6):411–417. - PubMed
    1. Meyer LA, et al. Endometrial cancer and Lynch syndrome: clinical and pathologic considerations. Cancer Control. 2009;16(1):14–22. doi: 10.1177/107327480901600103. - DOI - PMC - PubMed
    1. Bridge G, et al. DNA mismatch repair and oxidative DNA damage: implications for cancer biology and treatment. Cancers (Basel) 2014;6(3):1597–1614. doi: 10.3390/cancers6031597. - DOI - PMC - PubMed