. 2025 Feb 18;135(8):e177599.
doi: 10.1172/JCI177599. eCollection 2025 Apr 15.

Super-enhancer-driven EFNA1 fuels tumor progression in cervical cancer via the FOSL2-Src/AKT/STAT3 axis

Affiliations

Super-enhancer-driven EFNA1 fuels tumor progression in cervical cancer via the FOSL2-Src/AKT/STAT3 axis

Shu-Qiang Liu et al. J Clin Invest. .

Abstract

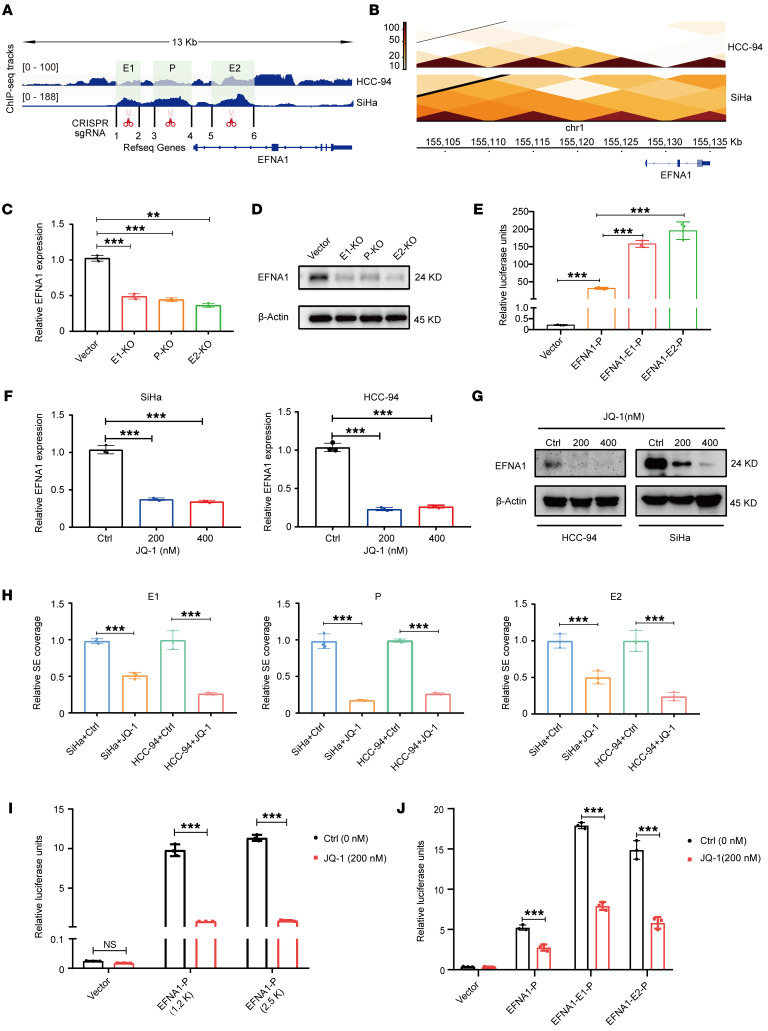
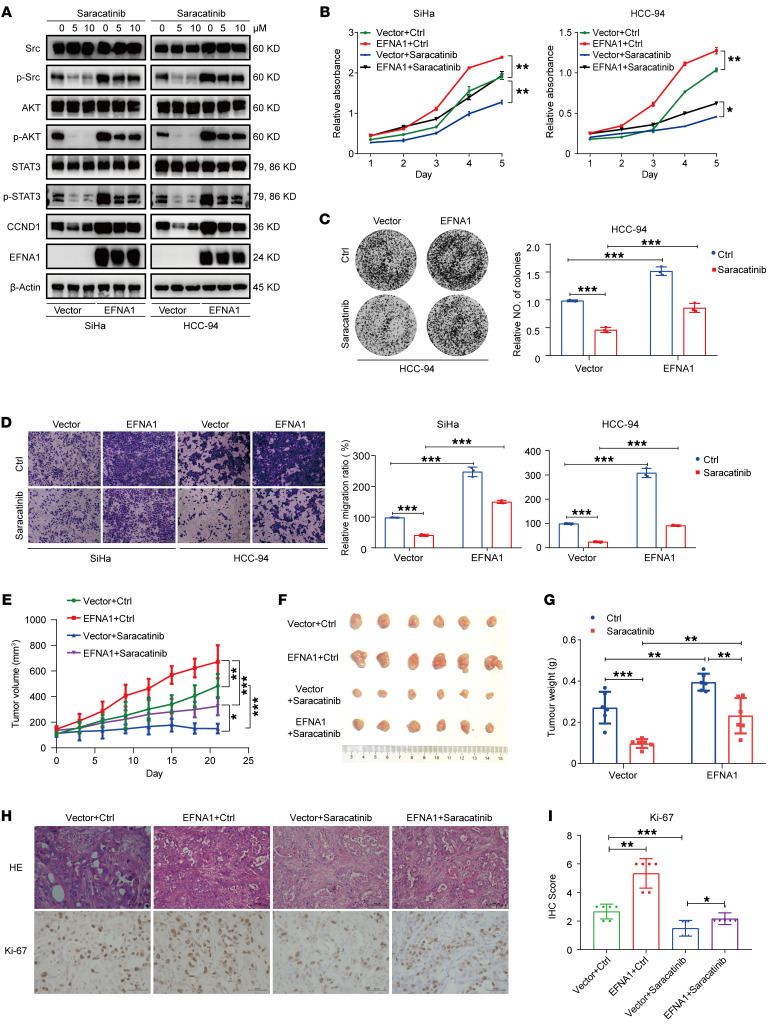
Super-enhancers (SEs) are expansive cis-regulatory elements known for amplifying oncogene expression across various cancers. However, their role in cervical cancer (CC), a remarkable global malignancy affecting women, remains underexplored. Here we applied integrated epigenomic and transcriptomic profiling to delineate the distinct SE landscape in CC by analyzing paired tumor and normal tissues. Our study identifies a tumor-specific SE at the EFNA1 locus that drives EFNA1 expression in CC. Mechanically, the EFNA1-SE region contains consensus sequences for the transcription factor FOSL2, whose knockdown markedly suppressed luciferase activity and diminished H3K27ac enrichment within the SE region. Functional analyses further underlined EFNA1's oncogenic role in CC, linking its overexpression to poor patient outcomes. EFNA1 knockdown strikingly reduced CC cell proliferation, migration, and tumor growth. Moreover, EFNA1 cis-interacted with its receptor EphA2, leading to decreased EphA2 tyrosine phosphorylation and subsequent activation of the Src/AKT/STAT3 forward signaling pathway. Inhibition of this pathway with specific inhibitors substantially attenuated the tumorigenic capacity of EFNA1-overexpressing CC cells in both in vitro and in vivo models. Collectively, our study unveils the critical role of SEs in promoting tumor progression through the FOSL2-EFNA1-EphA2-Src/AKT/STAT3 axis, providing new prognostic and therapeutic avenues for CC patients.

Keywords: Cell biology; Cervical cancer; Epigenetics; Oncology.


Figures

Figure 1
Figure 1. Global landscape of SEs in CC.
(A) Graphical overview of the study design. (B) Principal component analysis (PCA) of H3K27ac levels from 2,614 SEs in 9 CC samples and their corresponding normal tissues. Tumor (red) and normal samples (blue) are represented by circles. (C) Heatmap illustrating differential SE activity in the 9 CC samples compared with their paired normal tissues. H3K27ac signals are raw-scaled, with the color spectrum ranging from red (high intensity) to blue (low intensity), indicating H3K27ac signal intensity. (D) Visualization of H3K27ac signals across 2,614 SEs. The x axis represents individual SEs, while the y axis portrays the log2 fold change in H3K27ac signals in CC relative to matched normal tissues. Red dots highlight 26 genes upregulated in CC compared with normal tissues that are considered potential SE targets. Numbers in parentheses indicate the rank order based on the fold increase of SEs in CC relative to normal counterparts. (E) Venn diagram illustrating the overlap between genes with upregulated expression in tumor and those targeted by elevated SEs in CC. (F) Scatterplot showing survival analysis for the 26 SE-targeted genes identified in E. The x axis represents hazard ratio (HR), and the y axis represents P values. Horizontal dashed line represents P = 0.05, and vertical dashed line represents HR = 1. Genes marked in red are upregulated and have a significant association with a poorer overall survival rate in CC patients. Patients were divided into 2 groups based on the median expression level of each gene. The statistical significance of differences between the 2 groups was assessed using the log-rank test. (G) H3K27ac ChIP-Seq signals mapped proximate to the EFNA1 locus in CC (T) and NOR samples (N).
Figure 2
Figure 2. Identification of EFNA1 as an SE-driven gene in CC.
(A) Schematic diagram illustrating H3K27ac ChIP-Seq signals proximate to the EFNA1 locus in SiHa and HCC-94 cells and the CRISPR/Cas9–mediated deletions targeting EFNA1-SEs. (B) Topologically associated domain (TAD) regions at the EFNA1 locus, predicted based on Hi-C data from CC cells. The heatmap color gradient, from white to red, represents the interaction intensity between the SE and the EFNA1 promoter region, ranging from low to high. (C and D) Analysis of EFNA1 expression in SiHa cells following EFNA1-SE deletions, including E1 (E1-KO), E2 (E2-KO), and promoter (P-KO) regions. mRNA levels were measured by quantitative reverse transcription–PCR (qRT-PCR) (C), and protein levels were assessed by Western blot (D), with β-actin serving as the internal control. (E) Dual-luciferase reporter assays in HEK293T cells assessing the enhancer activities of EFNA1 promoter (EFNA1-P) and EFNA1-SEs (EFNA1-E1-P, EFNA1-E2-P). (F and G) EFNA1 expression in CC cells treated with various concentrations of JQ1. qRT-PCR results (F) and Western blot results (G) are shown, with vehicle-treated cells as the control. (H) qPCR assay showing H3K27ac enrichments at the EFNA1 promoter (P) and SE regions (E1, E2) from ChIP assays in CC cells. The ChIP assays were conducted using H3K27ac antibodies, in cells treated either with or without 200 nM JQ1 for 24 hours. (I and J) Luciferase reporter assays assessing the transcriptional activity of the EFNA1 promoter (1.2 K and 2.5 K) (I) and the combined EFNA1 promoter and SE regions, EFNA1-P-SEs (J), in HEK293T cells treated with 200 nM JQ1 or vehicle control for 24 hours (EFNA1-E1-P, EFNA1-E2-P). Data are presented as mean ± SD, with n = 3 replicates. Between-group comparisons: 1-way ANOVA test. Significant P values: **P < 0.01, ***P < 0.001.
Figure 3
Figure 3. FOSL2 regulates EFNA1 transcription through binding to SE regions.
(A) Venn diagram presenting potential transcription factors binding to the SE regions (E1 and E2) and the core promoter region of EFNA1. (B) Pearson’s correlation analysis showing the positive correlation between EFNA1 and FOSL2 expression in CC samples from the TCGA database (27). TPM, transcripts per million. (C) Expression of FOSL2 and EFNA1 in SiHa and HCC-94 cells transiently transfected with siRNAs targeting FOSL2 or control siRNA. mRNA expression was determined using qRT-PCR. (D and E) Western blotting showing the protein expression levels of FOSL2 and EFNA1 following FOSL2 knockdown (D) or overexpression (E). (F and G) Luciferase reporter assay showing EFNA1 promoter activity in HEK293T cells with FOSL2 knockdown (F) or overexpression (G). (H) Gene tracks showing FOSL2 ChIP-Seq occupancy at the EFNA1 loci in SiHa and HCC-94 cell lines. The x axis shows genomic position, and the y axis shows ChIP-Seq occupancy signal in reads per million mapped reads per base pair (rpm/bp). (IK) qPCR assay showing FOSL2 and H3K27ac enrichments at the EFNA1 core promoter and SE regions from ChIP assay in HCC-94 cells with FOSL2 and H3K27ac antibodies. Data are presented as mean ± SD from 3 independent experiments. (L) Schematic diagram showing the EFNA1 E2 region (from chr1:155,100,545–155,103,815) with an FOSL2 binding motif (from chr1:155,101,975–155,101,985). (M) Luciferase activity of the indicated plasmids in HEK293T cells. After 48 hours of transfection of specified plasmid, luciferase activity was determined and normalized to pRL-TK luciferase activity. Data are presented as mean ± SD across n = 3 replicates. Statistical analysis was performed using Pearson’s correlation test in B, 1-way ANOVA test in C, F, G, IK, and M. Significant P values: **P < 0.01, ***P < 0.001.
Figure 4
Figure 4. EFNA1 acts as an oncogene in CC.
(A) Western blot assay showing the knockdown efficiency of EFNA1 in SiHa and HCC-94 cells transfected with siRNAs specifically targeting EFNA1 or control siRNA. β-Actin serves as a loading control. (B) CCK-8 assay showing the cell growth rate of cells described in A. Absorbance from day 1 to day 4 was normalized to day 0 values. (C) Representative images of EdU staining in SiHa cells from A. The corresponding statistical analysis is presented at the bottom. (D) Statistical results of Transwell assay showing the migration ability of SiHa and HCC-94 cells infected with lentivirus expressing EFNA1 shRNAs or control shRNA. (E) Representative images of flow cytometry analysis of apoptosis in SiHa cells described above, using annexin V–FITC/propidium iodide staining. Quantification is presented on the right. (FK) Tumorigenesis measurements in nude mice subcutaneously injected with SiHa cells expressing EFNA1 knockdown shRNA or control shRNA (FH), and SiHa cells with stable EFNA1 overexpression or control vectors (IK). Tumor volumes were measured (F and I), and tumors were photographed (G and J) and weighed (H and K) after mice were sacrificed. Scale bars: 100 μm. Between-group comparisons: 1-way ANOVA test. Significant P values: **P < 0.01, ***P < 0.001.
Figure 5
Figure 5. EFNA1 stimulates the Src/AKT/STAT3 signaling pathway.
(A) Volcano plot illustrating the DEGs in HCC-94 cells following EFNA1 knockdown relative to control cells, based on RNA-Seq analysis (FDR < 0.01). The x axis shows log2 fold change, and the y axis shows log10 P. (B) Top pathways affected by EFNA1 knockdown as identified by Gene Ontology analysis for the DEGs as described in A. (C and D) Human phospho-kinase array results showing the phosphorylated proteins in SiHa cells transfected with EFNA1 siRNAs or control siRNA. Numbered boxes are highlighted targets and phosphorylation sites listed on the table at right (D). Red dots indicate upregulated phosphorylated proteins, while green dots represent downregulated ones (D). (EH) Western blot assays showing protein levels of the Src/AKT/STAT3 pathway and its downstream genes in SiHa and HCC-94 cells following EFNA1 knockdown (E and F) or overexpression (G and H). β-Actin or GAPDH serves as a loading control.
Figure 6
Figure 6. EphA2 mediates EFNA1 signals through cis-interaction with EFNA1.
(A and B) Western blot analyses of immunoprecipitated products using anti-EFNA1 (A) or anti-EphA2 (B) antibodies in SiHa and HCC-94 cells. (C) Schematic representation of the domain structure of wild-type EphA2 and its mutants. LBD, ligand binding domain; SD, sushi domain; ELD, epidermal growth factor–like domain; FND, fibronectin type III domains; KD, kinase domain; SAMD, sterile-α-motif domain; PD, PDZ binding domain. (D) Co-IP assays in SiHa cells cotransfected with EFNA1-HA and either EphA2WT,FLAG, EphA2ΔLCF2,FLAG, EphA2ΔLBD,FLAG, EphA2ΔEXT,FLAG, EphA2ΔFNIII, or EphA2ΔLBD-KD,FLAG plasmids. Immunoprecipitations were performed using anti-HA antibodies. (E) Western blot analysis of the total and phosphorylated protein levels of EphA2 and AKT in SiHa and HCC-94 cells with EFNA1 overexpression. GAPDH serves as a loading control. (F and G) Western blot analyses of EphA2 and downstream cascades in HCC-94 cells with concurrent EphA2 knockdown and EFNA1 knockdown (F) or EFNA1 overexpression (G). GAPDH serves as a loading control. (H) Western blot analysis of EphA2 and downstream cascades in HCC-94 cells with concurrent EphA2 and EFNA1 overexpression. GAPDH serves as a loading control. (I) CCK-8 assay for cell proliferation in SiHa and HCC-94 cells with EFNA1 knockdown alone or combined knockdown of both EFNA1 and EphA2. (J and K) Colony formation assay for cells described in I, with corresponding statistical data presented in K. (L and M) Representative images of Transwell assay showing the migration ability of cells described in I, with statistics shown on the right in M. Scale bars: 100 μm. Between-group comparisons: 1-way ANOVA test. Significant P values: *P <0.05, **P < 0.01.
Figure 7
Figure 7. Saracatinib mitigates EFNA1-driven tumorigenesis in CC.
(A) Western blot analyses of Src/AKT/STAT3 signaling pathway proteins and downstream genes in SiHa and HCC-94 cells with or without EFNA1 overexpression and saracatinib treatment. GAPDH serves as a loading control. (B) CCK-8 assay showing cell proliferation curves for cells described in A. (C) Colony formation for cells described in A, with corresponding statistical analysis on the right. (D) Representative images for Transwell assay showing migration ability of cells described in A, with statistical data indicated on the right. Scale bar: 200 μm. (EG) Tumorigenesis measurements in nude mice subcutaneously injected with HCC-94 cells stably expressing EFNA1 or control vectors, and then treated with saracatinib or control vehicle. Tumor volumes were measured every 3 days (E). Tumors were photographed (F) and weighed (G) after the mice were sacrificed. (H and I) H&E staining results and IHC of Ki-67 in tumors described in F, with corresponding statistics presented on the right. Scale bars: 100 μm. Between-group comparisons: 1-way ANOVA test. Significant P values: *P < 0.05, **P < 0.01, ***P < 0.001.
Figure 8
Figure 8. Elevated EFNA1 expression correlates with poor prognosis in CC patients.
(A) Representative IHC images showing EFNA1 expression in cervical tumors and their paired normal tissues from Figure 1. Scale bars: 100 μm (left), 800 μm (right). (B) Transcriptome analysis of EFNA1 expression in CC and other squamous cell carcinoma from the TCGA database. The y axis represents expression levels in transcripts per million, while the x axis lists various cancer types. CESC, cervical squamous cell carcinoma; ESCA, esophageal cancer; HNSC, head and neck cancer; LUSC, lung squamous cell carcinoma; STAD, stomach adenocarcinoma; UCEC, uterine corpus endometrial carcinoma; UCS, uterine carcinosarcoma. (C) Violin plot showing EFNA1 mRNA levels in cervical tumor cells and normal cells using public single-cell sequencing data. (D) IHC scoring for EFNA1 in an independent cohort of CC patients (n = 109). Patients were categorized by T stages: I–II and III–IV. (E and F) Kaplan-Meier survival curves illustrating overall survival (E) and disease-free survival (F) rates for CC patients stratified by EFNA1 protein levels as determined by IHC and mRNA expression data from the TCGA database. Patients were divided into 2 groups based on the median expression level of EFNA1. (G) A schematic diagram of the proposed working model: EFNA1-SEs recruit transcription factors, particularly FOSL2, to enhance EFNA1 transcription, which subsequently activates the Src/AKT/STAT3 signaling axis, driving tumorigenesis in CC. Statistical analysis was performed using 2-tailed t test in C and D, log-rank test in E and F. Significant P values: **P < 0.01, ***P < 0.001.

References

    1. Sung H, et al. Global Cancer Statistics 2020: GLOBOCAN estimates of incidence and mortality worldwide for 36 cancers in 185 countries. CA Cancer J Clin. 2021;71(3):209–249. doi: 10.3322/caac.21660. - DOI - PubMed
    1. Monk BJ, et al. Integration of immunotherapy into treatment of cervical cancer: recent data and ongoing trials. Cancer Treat Rev. 2022;106:102385. doi: 10.1016/j.ctrv.2022.102385. - DOI - PMC - PubMed
    1. Burmeister CA, et al. Cervical cancer therapies: current challenges and future perspectives. Tumour Virus Res. 2022;13:200238. doi: 10.1016/j.tvr.2022.200238. - DOI - PMC - PubMed
    1. Bowden SJ, et al. Genetic variation in cervical preinvasive and invasive disease: a genome-wide association study. Lancet Oncol. 2021;22(4):548–557. doi: 10.1016/S1470-2045(21)00028-0. - DOI - PMC - PubMed
    1. Bowden SJ, et al. Risk factors for human papillomavirus infection, cervical intraepithelial neoplasia and cervical cancer: an umbrella review and follow-up Mendelian randomisation studies. BMC Med. 2023;21(1):274. doi: 10.1186/s12916-023-02965-w. - DOI - PMC - PubMed

MeSH terms