. 2025 Feb 25;44(2):115319.
doi: 10.1016/j.celrep.2025.115319. Epub 2025 Feb 17.

Luminescent sensing of conformational integrin activation in living cells

Affiliations

Luminescent sensing of conformational integrin activation in living cells

Giulia Villari et al. Cell Rep. .

Abstract

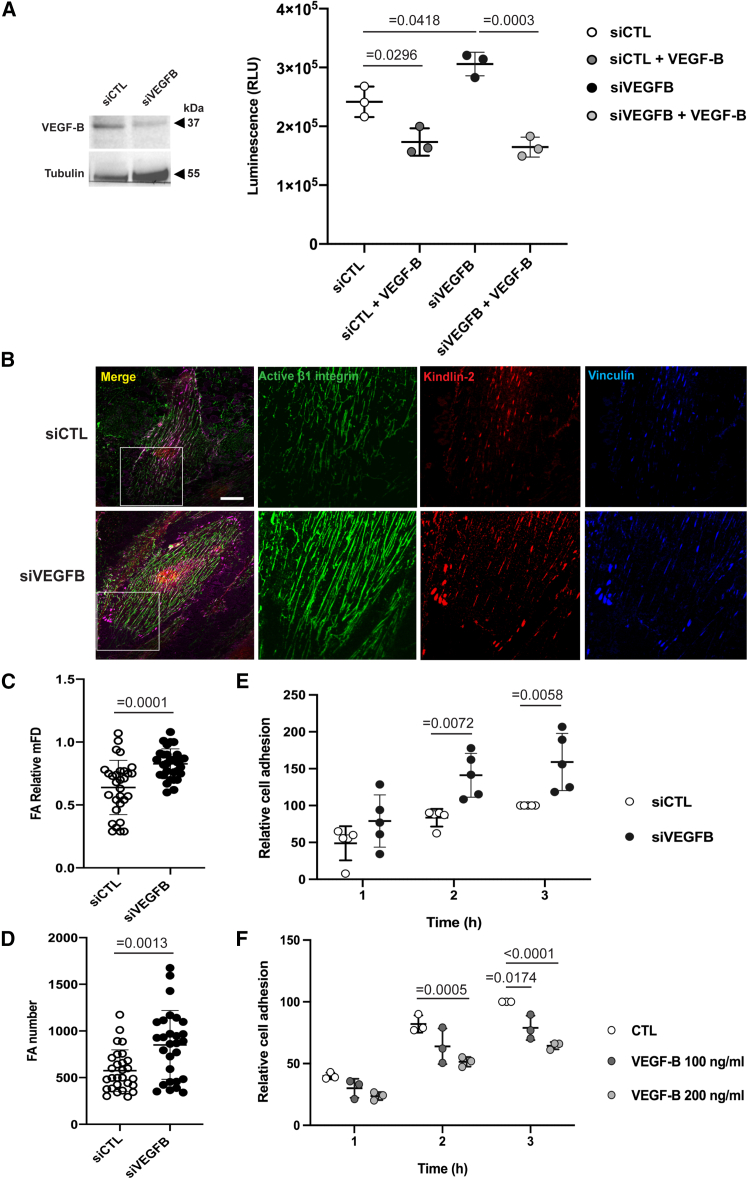
Integrins are major receptors for secreted extracellular matrix, playing crucial roles in physiological and pathological contexts, such as angiogenesis and cancer. Regulation of the transition between inactive and active conformation is key for integrins to fulfill their functions, and pharmacological control of those dynamics may have therapeutic applications. We create and validate a prototypic luminescent β1 integrin activation sensor (β1IAS) by introducing a split luciferase into an activation reporting site between the βI and the hybrid domains. As a recombinant protein in both solution and living cells, β1IAS accurately reports β1 integrin activation in response to (bio)chemical and physical stimuli. A short interfering RNA (siRNA) high-throughput screening on live β1IAS knockin endothelial cells unveils hitherto unknown regulators of β1 integrin activation, such as β1 integrin inhibitors E3 ligase Pja2 and vascular endothelial growth factor B (VEGF-B). This split-luciferase-based strategy provides an in situ label-free measurement of integrin activation and may be applicable to other β integrins and receptors.

Keywords: CP: Cell biology; angiogenesis; conformational sensor; endothelial cells; integrin activation; integrin inhibitors; luminescence.


Conflict of interest statement

Declaration of interests The authors declare no competing interests.

Figures

None
Graphical abstract
Figure 1
Figure 1
Design and validation of β1IAS purified extracellular protein (A) Diagram of β1 integrin activation sensor (β1IAS) construct. Created with BioRender.com. (B) Molecular modeling of NanoBiT activity reconstruction in α5β1IAS during hybrid domain swing-out and headpiece opening. The headpiece structures of β1 integrin in closed and open conformations were modeled from PDB: 7CEB and 7CEB. The structure of NanoBiT was modeled from PDB: 7SNX. (C) The ectodomains of α5β1 WT and α5β1IAS were expressed with a C-terminal disulfide-linked ACID-BASE coiled coil in Expi293F or HEK293 cells. The presence of purified soluble proteins was detected by western blot using anti-α5 (A11) and anti-β1 (TS2/16) in non-reducing conditions. (D) Luminescence of purified ectodomain of α5β1IAS with (clasped) or without (unclasped) the ACID-BASE coiled coil and in the absence (CTL) or presence of immobilized BSA or fibronectin (FN) under resting (Ca2+) or activating (Mn2+) metal ion conditions. Data are mean ± SD of three independent experiments. Statistical analysis: one-way ANOVA and Bonferroni’s post hoc analysis.
Figure 2
Figure 2
β1IAS functional characterization in β1−/− MEFs (A) Top: western blot showing the expression of β1 integrin and NanoBiT in β1 integrin-null (β1−/−) mouse embryonic fibroblasts (MEFs) transduced with retroviral vector pLZRS-human WT β1 integrin (β1WT) or -β1IAS. Bottom: fluorescence-activated cell sorting (FACS) analysis using 9EG7 antibody in WT MEFs, β1−/−, and β1−/− transduced with β1IAS (β1−/−/β1IAS). (B) Relative adhesion measured by the xCELLigence system in WT, β1−/−, and β1−/−/β1IAS MEFs plated on FN. Data are the mean ± SD of three independent experiments. Statistical analysis: two-way ANOVA and Bonferroni’s post hoc analysis. (C) Confocal microscopy showing vinculin (green) and 9EG7+ active β1 integrins (red) in WT, β1−/−, and β1−/−/β1IAS MEFs plated on FN. The left image insets highlight focal adhesion sites. Scale bar: 20 μm. (D) Luminescent microscopy in the presence of furimazine of β1−/− MEFs transfected with either intact NanoLuc (left) or β1IAS (right) and plated on FN. Image insets show how most photons generated by β1IAS localize into bona fide focal adhesion sites (right) compared to the random localization of intact NanoLuc (left). Low-magnification (left) scale bars: 20 μm; high-magnification (right) scale bars: 5 μm. (E) Luminescence of β1−/−/β1IAS MEFs adhering for 30 min to increasing amounts (125–1,000 ng/mL) of FN compared to β1−/− MEFs transfected with intact NanoLuc (β1−/−/NanoLuc). Data are mean ± SD of three independent experiments. Statistical analysis: two-way ANOVA and Bonferroni’s post hoc analysis. (F) Luminescence of β1−/−/β1IAS MEFs adhering for 30 min to FN-coated, increasingly stiff (0.5, 10, and 100 kPa) PAGEs compared to β1−/− MEFs transfected with intact NanoLuc (β1−/−/NanoLuc). Data are mean ± SD of three independent experiments. Statistical analysis: two-way ANOVA and Bonferroni’s post hoc analysis.
Figure 3
Figure 3
β1IAS functional characterization in genetic β1IAS KI TeloHAECs (A) Western blot showing the expression of β1 integrin and NanoBiT tag in β1IAS knockin (KI) ECs compared to WT TeloHAECs (parental). (B) Relative adhesion measured by the xCELLigence system in β1IAS KI ECs plated on FN compared to parental ECs. Data are the mean ± SD of four independent experiments. Statistical analysis: two-way ANOVA and Bonferroni’s post hoc analysis. (C) Luminescence of β1IAS KI ECs adhering for 30 min to increasing amounts (125–1,000 ng/mL) of FN, collagen type I (Coll I), or laminin 511 (Lam 511). Data are mean ± SD of three independent experiments. Statistical analysis: two-way ANOVA and Bonferroni’s post hoc analysis. (D) Luminescence of β1IAS KI ECs adhering for 30 min to increasing amounts (125–1,000 ng/mL) of vitronectin (VN). Data are mean ± SD of three independent experiments. Statistical analysis: one-way ANOVA and Bonferroni’s post hoc analysis. (E) Luminescence of β1IAS KI ECs adhering for 30 min to FN-coated, increasingly stiff (10 and 100 kPa) PAGEs. Data are mean ± SD of four independent experiments. Statistical analysis: two-tailed heteroscedastic Student’s t-test. (F) Luminescence of β1IAS KI ECs adhering for 15 min to 500 ng/mL FN in the presence of 9EG7 and 12G10 antibodies. Data are mean ± SD of three independent experiments. Statistical analysis: one-way ANOVA and Bonferroni’s post hoc analysis. (G) Luminescence of β1IAS KI ECs adhering for 15 min to 500 ng/mL FN in the presence of mAb13 or the pan-αv integrin and α5β1 antagonist MK-0429 (100 μM). Data are mean ± SD of three independent experiments. Statistical analysis: one-way ANOVA and Bonferroni’s post hoc analysis. (H) Luminescence of control β1IAS KI ECs (siCTL) and β1IAS KI ECs silenced for TLN1, FERMT2, and FERMT3 and then plated on 500 ng/mL FN. Data are mean ± SD of three independent experiments. Statistical analysis: one-way ANOVA and Bonferroni’s post hoc analysis. (I) Luminescence of control β1IAS KI ECs (siCTL) and β1IAS KI ECs silenced for FLRT2, LPHN2, and PLXND1 and then plated on 500 ng/mL FN. Data are mean ± SD of three independent experiments. Statistical analysis: one-way ANOVA and Bonferroni’s post hoc analysis.
Figure 4
Figure 4
siRNA HTS in β1IAS TeloHAECs to identify activators and inhibitors of β1 integrin (A) Schematic of the high-throughput screening (HTS)-selected genes (194), among the 2,970 genes expressed by parental WT TeloHAECs, whose silencing in β1IAS KI ECs induces a decreased luminescent signal (Z score < −2), therefore β1 integrin activators (142, in green), and those whose silencing induces an increased luminescent signal (Z score > 2), therefore β1 integrin inhibitors (52, in red). (B) Bubble plot representing top integrin focused enriched pathways (adjusted p < 0.05) based on candidate genes obtained from the HTS (2 < Z score < −2). All enriched pathways are listed in Table S2. The EnrichR combined score is the log of the p value from the Fisher exact test multiplied by the Z score of the deviation from the expected rank. Bubble color (adjusted p value) was computed using the Benjamini-Hochberg method for correction for multiple hypotheses testing. The gene ratio is the overlap between the input list and the gene sets in each gene set library for ranking a pathway’s relevance to the input list. (C) Luminescent intensity Z score mean of three biological replicates for each endothelial gene whose siRNA was contained in the Qiagen Druggable Genome v.3 siRNA library. The listed genes (β1 integrin inhibitors in red and β1 integrin activators in green) were chosen for secondary validation. (D) Luminescence of control β1IAS KI ECs (siCTL) and β1IAS KI ECs silenced for RAP1B, TNS3, and RHOJ and then plated on 500 ng/mL FN. Data are mean ± SD of three independent experiments. Statistical analysis: one-way ANOVA and Bonferroni’s post hoc analysis. (E) Luminescence of control β1IAS KI ECs (siCTL) and β1IAS KI ECs silenced for RACGAP1, PJA2, and VEGF-B and then plated on 500 ng/mL FN. Data are mean ± SD of three independent experiments. Statistical analysis: one-way ANOVA and Bonferroni’s post hoc analysis.
Figure 5
Figure 5
The E3 ubiquitin ligase PJA2 promotes kindlin-2 degradation and inhibits β1 integrin activation in ECs (A) Left: western blot showing the expression of PJA2 in WT TeloHAECs after PJA2 silencing and silenced cells transduced with silencing resistant murine PJA2 (mPJA2). Right: luminescence intensity of β1IAS KI ECs plated on 500 ng/mL FN, silenced for PJA2, and rescued with mPJA2. Data are mean ± SD of three independent experiments. Statistical analysis: one-way ANOVA and Bonferroni’s post hoc analysis. (B) Western blot showing the expression of kindlin-2, talin-1, and Rap1B in WT TeloHAECs after PJA2 silencing. (C) Left: western blot showing ubiquitinated GFP kindlin-2 pulled down by ubiquitin affinity beads in Phoenix cells overexpressing PJA2 or control construct. The first lane corresponds to the incubation of lysate from cells overexpressing control constructs on non-ubiquitinated beads (see STAR Methods). Right: western blot showing the expression of PJA2 in cells used in the ubiquitinated assay shown on the left. (D) Confocal microscopy showing 9EG7+ active β1 integrin (green), kindlin-2 (red) and vinculin (blue) in WT TeloHAECs plated on 1.5 μg/mL FN and silenced for PJA2. The image insets highlight focal adhesion sites. Scale bar: 20 μm. (E) Relative maximum Feret diameter (mFD) of adhesion sites (FA) in WT TeloHAECs silenced for PJA2 compared to siCTL. Data are the mean ± SD of three independent experiments (10 cells each). Statistical analysis: two-tailed heteroscedastic Student’s t test. (F) Number of adhesion sites (FA) in siCTL and siPJA2 ECs as in (E). Data are the mean ± SD of three independent experiments (9 cells each). Statistical analysis: two-tailed heteroscedastic Student’s t test.
Figure 6
Figure 6
VEGF-B is an effective inhibitor of β1 integrin activation in ECs (A) Left: western blot showing the expression of VEGF-B protein in WT TeloHAECs after VEGFB silencing compared to siCTL. Right: luminescence of TeloHAEC β1IAS plated on 500 ng/mL FN and silenced for VEGFB in the presence or absence of exogenous VEGF-B for 15 min. Data are mean ± SD of three independent experiments. Statistical analysis: one-way ANOVA and Bonferroni’s post hoc analysis. (B) Confocal microscopy showing 9EG7+ active β1 integrin (green), kindlin-2 (red), and vinculin (blue) in WT TeloHAECs plated on 1.5 μg/mL FN and silenced for VEGFB. The image insets highlight focal adhesion sites. Scale bar: 20 μm. (C) Relative maximum Feret diameter (mFD) of adhesion sites (FA) in WT TeloHAECs silenced for VEGFB compared to siCTL. Data are the mean ± SD of three independent experiments (10 cells each). Statistical analysis: two-tailed heteroscedastic Student’s t test. (D) Number of adhesion sites (FA) in WT TeloHAECs silenced for VEGFB compared to siCTL. Data are the mean ± SD of three independent experiments (9 cells each). Statistical analysis: two-tailed heteroscedastic Student’s t test. (E) Relative adhesion measured by the xCELLigence system in WT TeloHAECs plated on 1.5 μg/mL FN and silenced for VEGFB. Data are the mean ± SD of five independent experiments. Statistical analysis: two-way ANOVA and Bonferroni’s post hoc analysis. (F) Relative adhesion measured by the xCELLigence system in WT TeloHAECs plated on 1.5 μg/mL FN and treated or not with 100 and 200 ng/mL exogenous VEGF-B. Data are the mean ± SD of three independent experiments. Statistical analysis: two-way ANOVA and Bonferroni’s post hoc analysis.
Figure 7
Figure 7
VEGF-B modulates the phosphorylation of CMSC mediators (A and B) Volcano plots of the phosphoproteome of parental WT TeloHAECs stimulated with VEGF-B or control for 15 (A) or 30 (B) min. n = 4 biological replicates. Colored dots are phosphorylation sites of proteins annotated to the GOBP categories “cell adhesion” or “cytoskeleton organization.” Dashed bars separate significantly regulated sites with p ≤ 0.05 and difference ≥ ±0.2. The position of the phosphorylation site within the protein sequence is in parentheses following the gene name. (C and D) Heatmaps of the up- and downregulated sites highlighted in the volcano plots in (A) and (B), respectively. Colors are based on the intensity values measured for the phosphorylated peptide by MaxQuant; purple represents upregulation upon VEGF-B stimulation, and green represents downregulation upon VEGF-B stimulation. An indicates a known regulatory site. (E) Left: confocal microscopy showing talin-1 (green) and KANK3 (red) in WT TeloHAECs plated on 1.5 μg/mL FN and silenced for VEGFB. The image insets highlight contact sites between talin-1+ adhesions and the CMSC mediator KANK3. Scale bar: 20 μm. Right: Pearson correlation between talin-1+ adhesions and the CMSC mediator KANK3. Data are the mean ± SD of two independent experiments (10 cells each). Statistical analysis: two-tailed heteroscedastic Student’s t test.

References

    1. Sebé-Pedrós A., Degnan B.M., Ruiz-Trillo I. The origin of Metazoa: a unicellular perspective. Nat. Rev. Genet. 2017;18:498–512. doi: 10.1038/nrg.2017.21. - DOI - PubMed
    1. Moreno-Layseca P., Icha J., Hamidi H., Ivaska J. Integrin trafficking in cells and tissues. Nat. Cell Biol. 2019;21:122–132. doi: 10.1038/s41556-018-0223-z. - DOI - PMC - PubMed
    1. Aman J., Margadant C. Integrin-Dependent Cell–Matrix Adhesion in Endothelial Health and Disease. Circ. Res. 2023;132:355–378. doi: 10.1161/CIRCRESAHA.122.322332. - DOI - PMC - PubMed
    1. Lilja J., Ivaska J. Integrin activity in neuronal connectivity. J. Cell Sci. 2018;131 doi: 10.1242/jcs.212803. - DOI - PubMed
    1. van der Meijden P.E.J., Heemskerk J.W.M. Platelet biology and functions: new concepts and clinical perspectives. Nat. Rev. Cardiol. 2019;16:166–179. doi: 10.1038/s41569-018-0110-0. - DOI - PubMed

Publication types

MeSH terms

LinkOut - more resources