. 2025 Feb 18;21(2):e1012707.
doi: 10.1371/journal.pcbi.1012707. eCollection 2025 Feb.

Tumor-immune partitioning and clustering algorithm for identifying tumor-immune cell spatial interaction signatures within the tumor microenvironment

Affiliations

Tumor-immune partitioning and clustering algorithm for identifying tumor-immune cell spatial interaction signatures within the tumor microenvironment

Mai Chan Lau et al. PLoS Comput Biol. .

Abstract

Background: Growing evidence supports the importance of characterizing the organizational patterns of various cellular constituents in the tumor microenvironment in precision oncology. Most existing data on immune cell infiltrates in tumors, which are based on immune cell counts or nearest neighbor-type analyses, have failed to fully capture the cellular organization and heterogeneity.

Methods: We introduce a computational algorithm, termed Tumor-Immune Partitioning and Clustering (TIPC), that jointly measures immune cell partitioning between tumor epithelial and stromal areas and immune cell clustering versus dispersion. As proof-of-principle, we applied TIPC to a prospective cohort incident tumor biobank containing 931 colorectal carcinoma cases. TIPC identified tumor subtypes with unique spatial patterns between tumor cells and T lymphocytes linked to certain molecular pathologic and prognostic features. T lymphocyte identification and phenotyping were achieved using multiplexed (multispectral) immunofluorescence. In a separate hepatocellular carcinoma cohort, we replaced the stromal component with specific immune cell types-CXCR3+CD68+ or CD8+-to profile their spatial relationships with CXCL9+CD68+ cells.

Results: Six unsupervised TIPC subtypes based on T lymphocyte distribution patterns were identified, comprising two cold and four hot subtypes. Three of the four hot subtypes were associated with significantly longer colorectal cancer (CRC)-specific survival compared to a reference cold subtype. Our analysis showed that variations in T-cell densities among the TIPC subtypes did not strictly correlate with prognostic benefits, underscoring the prognostic significance of immune cell spatial patterns. Additionally, TIPC revealed two spatially distinct and cell density-specific subtypes among microsatellite instability-high colorectal cancers, indicating its potential to upgrade tumor subtyping. TIPC was also applied to additional immune cell types, eosinophils and neutrophils, identified using morphology and supervised machine learning; here two tumor subtypes with similarly low densities, namely 'cold, tumor-rich' and 'cold, stroma-rich', exhibited differential prognostic associations. Lastly, we validated our methods and results using The Cancer Genome Atlas colon and rectal adenocarcinoma data (n = 570). Moreover, applying TIPC to hepatocellular carcinoma cases (n = 27) highlighted critical cell interactions like CXCL9-CXCR3 and CXCL9-CD8.

Conclusions: Unsupervised discoveries of microgeometric tissue organizational patterns and novel tumor subtypes using the TIPC algorithm can deepen our understanding of the tumor immune microenvironment and likely inform precision cancer immunotherapy.


Conflict of interest statement

We have read the journal’s policy and the authors of this manuscript have the following competing interests: C.S.F. is currently employed by Genentech, a subsidiary of Roche, and previously served as a consultant for Agios, Bain Capital, Bayer, Celgene, Dicerna, Five Prime Therapeutics, Gilead Sciences, Eli Lilly, Entrinsic Health, Genentech, KEW, Merck, Merrimack Pharmaceuticals, Pfizer Inc, Sanofi, Taiho, and Unum Therapeutics. J.A.M. has also served as an advisor/consultant to Ignyta, Array Pharmaceutical, and Cota. J.A.N. receives research funding from Natera and serves as a consultant for Leica Biosystems. J.K.L. is currently employed by BostonGene and owns company’s stock options. D.T. reports receiving research support from Novartis, Sirtex, and Bristol Myers Squibb. D.T. reports having received honorarium as an advisor for Novartis, Celgene, Sirtex, Merck Sharp & Dohme, Eisai, Ipsen, Bayer, and Bristol Myers Squibb.

Figures

Fig 1
Fig 1. Demonstration of the limitations of existing spatial analysis methods, namely nearest neighbor distance (NND), G-cross function and Morisita-Horn index.
Distinct spatial organization of CD3+ T cells in two representative tumor morphologies characterized by (a) stromal-predominant infiltrate, and (c) variable stromal and epithelial infiltrate, respectively, were simulated. In each tumor morphology, same amount of T cells either clustered within a small area (left panel, labelled as “Clustered”) or dispersed across the entire area (right panel, labelled as “Disperse”). In both simulated tumor morphologies (a, c), the two spatially distinct T-cell organizations demonstrate indistinguishably close (b, d) Morisita-Horn (M-H) indices and G-cross function AUCs. M-H index was computed based on a 5-by-5 µm rectangular grid; G-cross AUC was measured at r < 20 µm.
Fig 2
Fig 2. Implementation of TIPC, a computational method utilizing hexagonal tessellation and a classifier that evaluates multiple spatial parameters against a tumor region-specific null model represented by two global ratios based on the total number of immune (user-selected cell type of interest), tumor (global I:T) and stromal cells (global I:S).
Using the Cartesian coordinates of these cells, TIPC divides the space into a hexagonal grid of subregions of specified subregion size and calculates two local ratios namely I:T and I:S for each subregion. The subregions are then classified into six different categories based on comparing the local to the global I:T and I:S ratios. In this mIF-stained image example, there were 19 “Tumor only” subregions containing only tumor cells; 25 “I:T low” subregions with a local I:T ratio less than the global I:T ratio; and 31 “I:T high” subregions with a local I:T ratio greater than the global I:T ratio. The three stromal categories were counted in a similar way. The number of subregions in each category are then normalized using the total number of subregions containing cells of any type. The resultant six-element numerical vector encodes the tumor-immune spatial organization of the TME for an ROI. Abbreviations: I:T, immune-to-tumor, I:S, immune-to-stroma.
Fig 3
Fig 3. Characterization of CD3+ T-cell spatial distribution in the CRC tumor microenvironment using TIPC.
Using the optimal subregion size of 35 µm and input cluster number of 9 (which was jointly determined using (a) the consensus cumulative distribution function (CDF) delta plot (k ≥ 4) and (b) tracking plot (k = 9), see S2 Fig for details), the resulting TIPC tumor subtypes and their spatial patterns are represented in (c) a heat-map with corresponding CD3+ T-cell density; subtypes comprising <30 tumors were excluded. (d) Representative cases with similar CD3+ T-cell densities (all within the 3rd quartile) were selected from each of the six main TIPC subtype clusters to illustrate the distinct spatial organization of CD3+ T cells in CRC. From top to bottom, the panels show TIPC subregion categories, cell locations, multiplexed immunofluorescence-based histology, and H&E-stained histology of adjacent slides. TIPC spatial parameter values are depicted on a linear scale showing ordered from left to right: tumor-only, I:T low, I:T high, stroma-only, I:S low, I:S high subregion categories. Abbreviations: I:T = immune-to-tumor, I:S = immune-to-stroma, CSR = cold, stroma-rich, CTR = cold, tumor-rich, HTCC = hot, tumor-centric clustering, HD = hot and disperse, HSCC = hot, stroma-centric clustering, HC = hot and clustered, and O = outliers.
Fig 4
Fig 4. Comparison of TIPC performance with existing analysis methods, using CD3+ T-cell data.
Tumor subtypes were identified using (a-c) TIPC, (d-f) Morisita-Horn (M-H) tumor cell:CD3+, (g-i) G-cross tumor cell:CD3+, and (j-l) L-cross tumor cell:CD3+. Box plots show that (a) TIPC subtypes were less confounded by the overall CD3+ T-cell density as compared to (d,g,j) other methods. Kaplan-Meier and log-rank test show (b,c,e,f,h,i) subtyped derived by TIPC, M-H, and G-cross harbored significant associations with colorectal cancer-specific survival, but otherwise for (k,l) L-cross method. G-cross and L-cross AUC quartiles were measured using radius of 20 µm based on stromal CD3+ cells (S7 and S8 Figs); M-H index was calculated using a 5-by-5 µm rectangular grid and 80th percentile dichotomization cut-off (S5 Fig); TIPC subtypes were obtained at the optimal subregion size of 35 µm and input number of clusters of 9 (S2 Fig). Abbreviations: CSR = Cold, stroma-rich; CTR = Cold, tumor-rich; HTCC = Hot, tumor-centric clustering; HD = Host and disperse; HSCC = Hot, stroma-centric clustering; HC = Hot and clustered.
Fig 5
Fig 5. Prognostic and molecular associations TIPC subtypes identified using CD3+ T-cells in CRC.
(a) Forest plots show the hazard ratios and confidence intervals determined using univariate and multivariate Cox regression models; symbols *** p < 0.001, ** p < 0.01, * p < 0.05, not significant (ns) p > 0.05. (b) Performance evaluation on the effect of subregion sizes and cluster number (k) on spatial subtype identification and prognostic significance, based on univariate Cox PH regression model (see S17 Fig for full data). (c) Stacked bar plots show the enrichment of clinicopathological features within individual TIPC subtypes, where extended Cochran–Armitage test was used to test the association significance. Abbreviations: CSR = cold, stroma-rich, CTR = cold, tumor-rich, HTCC = hot, tumor-centric clustering, HD = hot and disperse, HSCC = hot, stroma-centric clustering, and HC = hot and clustered. TIPC subtypes shown in (a,c) were obtained using the optimal subregion size of 35µm and input number of clusters of 9 (see S2 Fig).
Fig 6
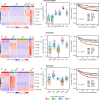
Fig 6. TIPC application on three different immune cell types, namely (a-c) cytotoxic memory T cells, (d-f) eosinophils, and (g-i) neutrophils in CRC (NHS/ HPFS).
(a,d,g) Heat maps display the distinct immune cell organization of the resulting TIPC subtypes which demonstrate (b,e,h) variable but overlapping immune cell densities. (c,f,i) Kaplan-Meier and log-rank test show that these TIPC spatial subtypes were significantly associated with CRC-specific survival (see S3 Fig for the corresponding risk tables). Abbreviations, CSR = cold, stroma-rich, CTR = cold, tumor-rich, HD = hot and disperse, HTCC = hot, tumor-centric clustering, HSCC = hot, stroma-centric clustering, HC = hot and clustered, HCTR = hot and clustered, tumor-rich, HCSR = hot and clustered, stroma-rich.
Fig 7
Fig 7. Validation of TIPC spatial subtypes which were first determined in NHS/ HPFS cohort and later recapitulated in TCGA cohort, using eosinophils identified morphologically in H&E images.
(a) Among the five major TIPC subtypes determined in NHS/ HPFS cohort, three comprised of >30 tumors (i.e., CTR, HD, HCTR). (b) Kaplan-Meier estimates associated with these TIPC subtypes of eosinophils harbored significant association with overall survival (OS); (c) forest plot summarizes Cox regression analysis of tumor subtypes determined using cell density or nearest neighbor distance (NND) (see S19 Fig for the associations with disease-specific survival and progression-free intervals). Symbols *** p < 0.001, ** p < 0.01, * p < 0.05, not significant (ns) p > 0.05. Abbreviations, CTR = cold, tumor-rich, HD = hot and disperse, HCTR = hot and clustered, tumor-rich.
Fig 8
Fig 8. Using TIPC to discern spatial patterns of immune activity in an HCC cohort and their correlation with patient treatment response.
(a) Responders (Rs) exhibited a unique spatial pattern of CXCL9+/CXCR3+ CD68+ macrophages: a uniform distribution of CXCL9+CD68+ cells within tumor regions, along with the co-existence of CXCL9+CD68+ and CXCR3+CD68+ cells, identified as TIPC cluster 1, where CXCR3+CD68+ cells replaced stromal cells in the TIPC analysis. (b) Patients enriched with tumor areas deficient in CXCL9+CD68+ consistently correlate with adverse outcomes, identified as TIPC cluster 2. Additionally, Rs exhibited concurrent enrichment of CXCL9+CD68+ in both tumors and CD8+ regions, where CD8+ T cells replaced stromal cells in the TIPC analysis. Both sets of TIPC subtypes were obtained at the optimal subregion size of 30 µm and input number of clusters of 2, determined based on the most significant p values. Tumor cells were determined as those no expressing CD8, CD68, and CD45 expression.

References

    1. Abboud K, Umoru G, Esmail A, Abudayyeh A, Murakami N, Al-Shamsi HO, et al.. Immune checkpoint inhibitors for solid tumors in the adjuvant setting: current progress, future directions, and role in transplant oncology. Cancers. 2023;15(5). Epub 2023/03/12. doi: 10.3390/cancers15051433 ; PMCID: PMC10000896 - DOI - PMC - PubMed
    1. Lin JR, Chen YA, Campton D, Cooper J, Coy S, Yapp C, et al. High-plex immunofluorescence imaging and traditional histology of the same tissue section for discovering image-based biomarkers. Nat Cancer. 2023;4(7):1036–1052. Epub 2023/06/23. doi: 10.1038/s43018-023-00576-1 PMCID: PMC10368530. - DOI - PMC - PubMed
    1. Guerriero JL, Lin J-R, Pastorello RG, Du Z, Chen Y-A, Townsend MG, et al. Qualification of a multiplexed tissue imaging assay and detection of novel patterns of HER2 heterogeneity in breast cancer. npj Breast Cancer. 2024;10(1):2 doi: 10.1038/s41523-023-00605-3 - DOI - PMC - PubMed
    1. Rigamonti A, Viatore M, Polidori R, Rahal D, Erreni M, Fumagalli MR, et al. Integrating ai-powered digital pathology and imaging mass cytometry identifies key classifiers of tumor cells, stroma, and immune cells in non–small cell lung cancer. Cancer Res. 2024;84(7):1165–1177. doi: 10.1158/0008-5472.CAN-23-1698 - DOI - PMC - PubMed
    1. Takei S, Tanaka Y, Lin YT, Koyama S, Fukuoka S, Hara H, et al.. Multiomic molecular characterization of the response to combination immunotherapy in MSS/pMMR metastatic colorectal cancer. J Immunother Cancer. 2024;12(2). Epub 2024/02/10. doi: 10.1136/jitc-2023-008210 . - DOI - PMC - PubMed

LinkOut - more resources