. 2025 Feb 18;20(2):e0317505.
doi: 10.1371/journal.pone.0317505. eCollection 2025.

Transcriptomic analysis of human primary T cells after short-term leucine-deprivation and evaluation of kinase GCN2's role in regulating differential gene expression

Affiliations

Transcriptomic analysis of human primary T cells after short-term leucine-deprivation and evaluation of kinase GCN2's role in regulating differential gene expression

Aurore Dougé et al. PLoS One. .

Abstract

Chimeric Antigen Receptor T (CAR-T) cells offer a promising strategy for cancer treatment. These CAR-T cells are either autologous or allogeneic T cells that are genetically modified to express a chimeric antigen receptor targeting a specific tumor antigen. Ongoing research aims to optimize the CAR-T cell efficacy, including strategies to modulate their metabolism. One such approach involves inducing transgene expression by activating the GCN2 kinase signaling pathway through dietary deprivation of an essential amino acid. In this study, we investigated the general impact of a 6-hour leucine deprivation on primary activated human T cells using RNA-seq technology. Our analysis identified 3,431 differentially expressed genes between T cells cultured in regular medium and those cultured in leucine-deprived medium. Gene Set Enrichment Analysis revealed that "TNFα signaling via NFκB", "interferon-γ response", and "unfolded protein response" gene sets were positively enriched, while "mTORC1 signaling", "Myc targets", and "oxidative phosphorylation" gene sets were negatively enriched. To further evaluate the involvement of GCN2 kinase in regulating the differential gene expression during the 6-hour leucine deprivation, T cells were cultured with or without a GCN2 inhibitor. We found that 59% of the differentially expressed genes in our dataset were dependent on the kinase GCN2 (n = 2028), with 1,140 up-regulated and 888 down-regulated genes. These findings suggest a promising strategy to enhance CAR-T cell efficacy by combining short amino acid starvation with transient overexpression of a target gene.


Conflict of interest statement

The authors have declared that no competing interests exist.

Figures
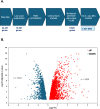
Fig 1
Fig 1. Identification of the differentially expressed genes (DEGs) between T cells cultured in control media and T cells cultured in leucine-deprived media for 6 hours.
A Bioinformatic methodology employed to select significant DEGs (adjusted p-value <  0.05; fold-change FC < or >  1). B. Volcano-plot displaying fold-change (Log2-FC) versus significance (-Log10 p-value). Red circles represent up-regulated genes (Log2-FC >  0) and blue circles represent down-regulated genes (Log2-FC <  0).
Fig 2
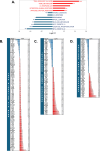
Fig 2. Gene Set Enrichment Analysis (GSEA) of T cells after culture in leucine-deprived media for 6 hours.
A GSEA using the Molecular Signatures Database (MSigDB) hallmark gene set collection. Results of gene set enrichment are expressed in Log2-FC. The number of stars indicates enrichment significance according to fgsea q-value ( * <  0.05, ** <  0.01, *** <  0.001). Red bars represent positively enriched gene sets (log2-FC >  0) and blue bars represent negatively enriched gene sets (log2-FC <  0). B. mRNA expression level of DEGs in the “TNFα signaling via NFκB” gene set. C. mRNA expression level of DEGs in the “interferon-γ response” gene set. D. mRNA expression level of DEGs in the “unfolded protein response” gene set. B-D. Results are expressed as a mRNA log2-fold-change between leucine-free (6h) and control media. Red bars represent up-regulated genes (log2-FC >  0) and blue bars represent down-regulated genes (log2-FC <  0).
Fig 3
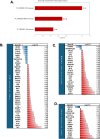
Fig 3. Transcription factor gene set enrichment analysis of T cells after culture in leucine-deprived media for 6 hours.
A TF-GSEA using TRRUST (Transcriptional Regulatory Relationships Unraveled by Sentence-based Text mining). Results of gene set enrichment are expressed in Log2-FC. The number of stars indicates enrichment significance according to meta q-value (** <  0.01, *** <  0.001). Red bars represent positively enriched gene sets (log2-FC >  0). B. mRNA expression level of DEGs in the JUN-regulated gene set. C. mRNA expression level of DEGs in the BRCA1-regulated gene set. D. mRNA expression level of DEGs in the ATF4-regulated gene set. B-D. Results are expressed as a mRNA log2-fold-change between leucine-free (6h) and control media. Red bars represent up-regulated genes (log2-FC >  0) and blue bars represent down-regulated genes (log2-FC <  0).
Fig 4
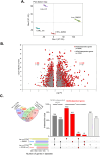
Fig 4. Identification of the DEGs between T cells cultured in control media and T cells cultured in leucine-deprived media for 6 hours with or without GCN2 inhibitor.
A Principal component analysis. C_DMSO represents the samples of T cells cultured in control media, Leu_DMSO represents the samples of T cells cultured in leucine-free media during 6h, C_Inh represents the samples of T cells cultured in control media with 2.5uM of GCN2 inhibitor, Leu_Inh represents the samples of T cells cultured in leucine-free media with 2.5uM of GCN2 inhibitor during 6h. B. Volcano-plot displaying fold-change (Log2-FC) versus significance (-Log10 p-value) according to GCN2-dependency. Red circles represent GCN2-dependent genes and grey circles represent GCN2-independant genes. C. UpSetR plot of the intersections of sets of DEG (up or down) in the 2 culture conditions (+DMSO or +  GCN2 inhibitor). Each dataset is shown at the left of the matrix as bar chart showing the size (number of gene) of the dataset. For each set of DEG filled circles connected by a black line are placed in the corresponding matrix cell. If a set is not part of the intersection, a light gray circle is shown. Intersections showing genes that are GCN2-independent are shown in dark grey, and intersections showing genes that are GCN2-dependent are shown in red. The size (number of genes) of each intersection is shown as a bar chart placed on top of the matrix. The same intersections are shown as a classical Venn diagram as an insert at the top left of the figure with matching color code.
Fig 5
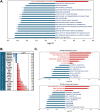
Fig 5. Gene Ontology (GO) and Gene Set Enrichment Analysis (GSEA) of T cells after culture in leucine-deprived media for 6 hours according to GCN2-dependency.
A GO using GO Biological Process of GCN2-dependent genes. Results of gene set enrichment are expressed in Log2-FC. The number of stars indicates enrichment significance according to meta q-value ( * <  0.05, ** <  0.01, *** <  0.001). Red bar represents positively enriched gene sets (log2-FC >  0) and blue bars represent negatively enriched gene sets (log2-FC <  0). B. mRNA expression level of GCN2-dependent DEGs in the “Cellular response to starvation” gene set. Red bars represent up-regulated genes (log2-FC >  0) and blue bars represent down-regulated genes (log2-FC <  0). C. GSEA using the Molecular Signatures Database (MSigDB) hallmark gene set collection according to GCN2-depency (up: GCN2-dependent genes; bottom: GCN2-independent genes). Results of gene set enrichment are expressed in Log2-FC. The number of stars indicates enrichment significance according to fgsea q-value ( * <  0.05, ** <  0.01, *** <  0.001). Red bars represent positively enriched gene sets (log2-FC >  0) and blue bars represent negatively enriched gene sets (log2-FC <  0).

References

    1. Dougé A, El Ghazzi N, Lemal R, Rouzaire P. Adoptive T cells therapy in solid tumors: state-of-the art, current challenges, and upcoming improvements. Mol Cancer Ther. 2023;23(3):272–84. doi: 10.1158/1535-7163.mct-23-0310 - DOI - PubMed
    1. Sterner RC, Sterner RM. CAR-T cell therapy: current limitations and potential strategies. Blood Cancer J. 2021;11(4):69. doi: 10.1038/s41408-021-00459-7 - DOI - PMC - PubMed
    1. Rial Saborido J, Völkl S, Aigner M, Mackensen A, Mougiakakos D. Role of CAR T cell metabolism for therapeutic efficacy. Cancers (Basel). 2022;14(21):5442. doi: 10.3390/cancers14215442 - DOI - PMC - PubMed
    1. Jenkins Y, Zabkiewicz J, Ottmann O, Jones N. Tinkering under the hood: metabolic optimisation of CAR-T cell therapy. Antibodies (Basel). 2021;10(2):17. doi: 10.3390/antib10020017 - DOI - PMC - PubMed
    1. Rostamian H, Fallah-Mehrjardi K, Khakpoor-Koosheh M, Pawelek JM, Hadjati J, Brown CE, et al.. A metabolic switch to memory CAR T cells: Implications for cancer treatment. Cancer Lett. 2021;500:107–18. doi: 10.1016/j.canlet.2020.12.004 - DOI - PubMed

MeSH terms

Substances

LinkOut - more resources