. 2025 Feb 18;20(2):e0317915.
doi: 10.1371/journal.pone.0317915. eCollection 2025.

Identification of biomarkers in Alzheimer's disease and COVID-19 by bioinformatics combining single-cell data analysis and machine learning algorithms

Affiliations

Identification of biomarkers in Alzheimer's disease and COVID-19 by bioinformatics combining single-cell data analysis and machine learning algorithms

Juntu Li et al. PLoS One. .

Abstract

Background: Since its emergence in 2019, COVID-19 has become a global epidemic. Several studies have suggested a link between Alzheimer's disease (AD) and COVID-19. However, there is little research into the mechanisms underlying these phenomena. Therefore, we conducted this study to identify key genes in COVID-19 associated with AD, and evaluate their correlation with immune cells characteristics and metabolic pathways.

Methods: Transcriptome analyses were used to identify common biomolecular markers of AD and COVID-19. Differential expression analysis and weighted gene co-expression network analysis (WGCNA) were performed on gene chip datasets (GSE213313, GSE5281, and GSE63060) from AD and COVID-19 patients to identify genes associated with both conditions. Gene ontology (GO) enrichment analysis identified common molecular mechanisms. The core genes were identified using machine learning. Subsequently, we evaluated the relationship between these core genes and immune cells and metabolic pathways. Finally, our findings were validated through single-cell analysis.

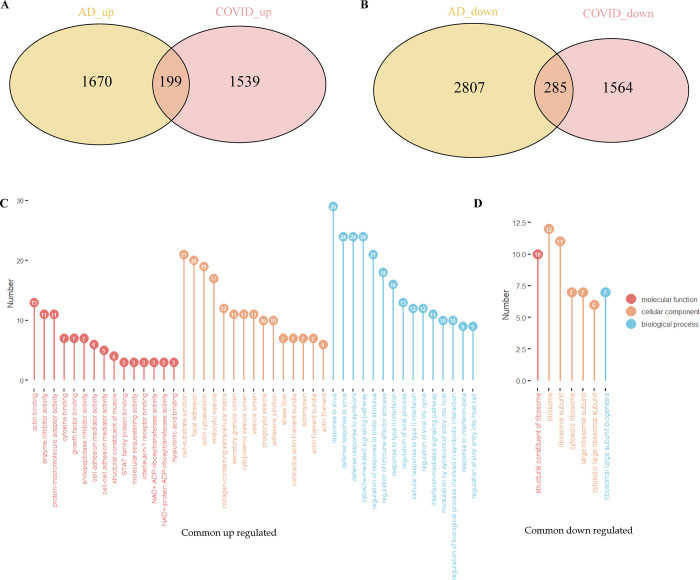
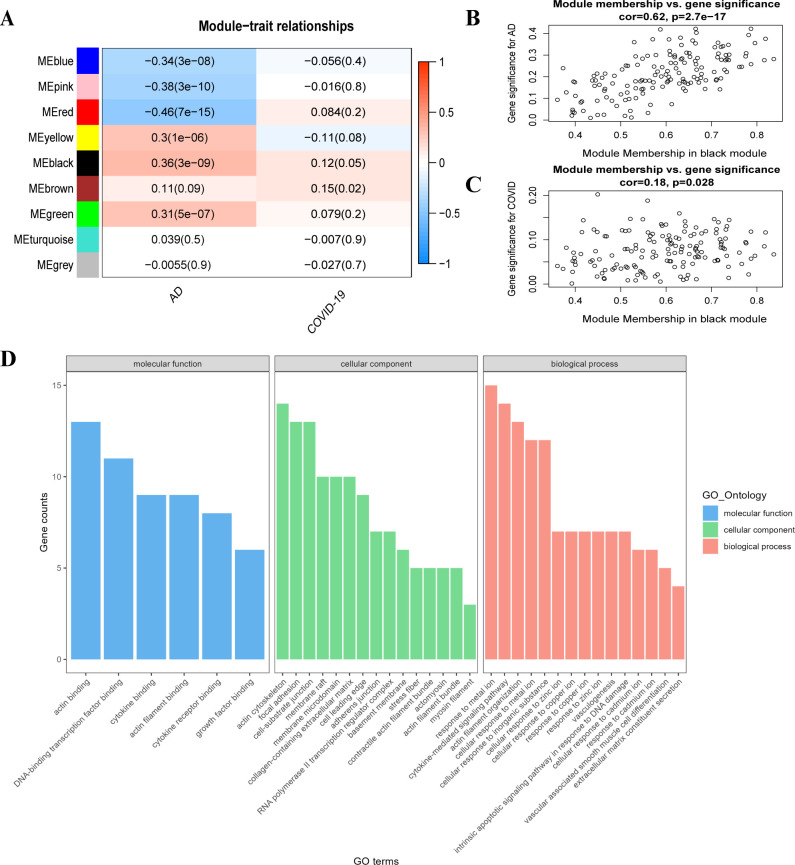
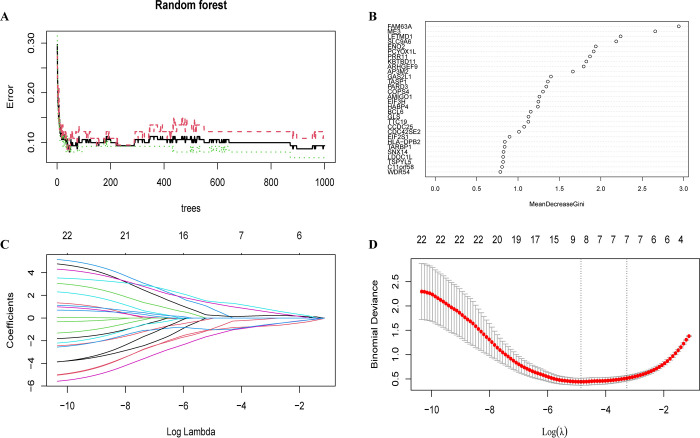
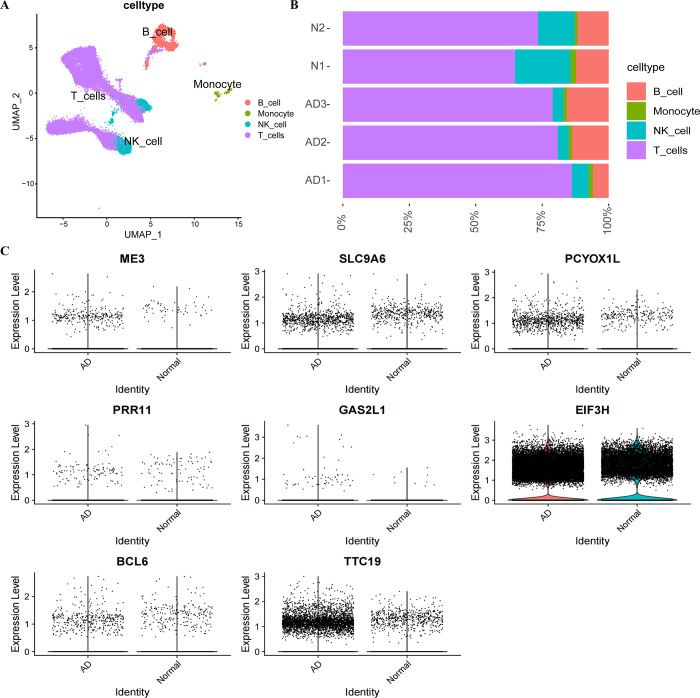
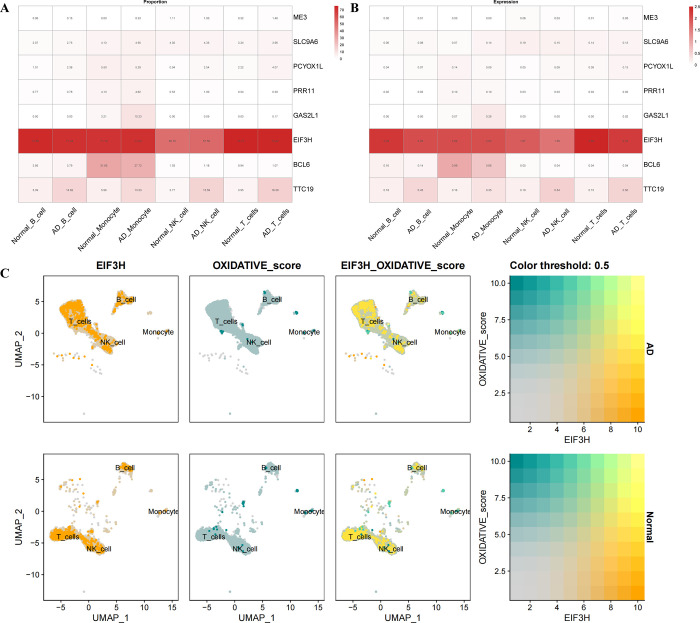
Results: The study identified 484 common differentially expressed genes (DEGs) by taking the intersection of genes between AD and COVID-19. The black module, containing 132 genes, showed the highest association between the two diseases according to WGCNA. GO enrichment analysis revealed that these genes mainly affect inflammation, cytokines, immune-related functions, and signaling pathways related to metal ions. Additionally, a machine learning approach identified eight core genes. We identified links between these genes and immune cells and also found a association between EIF3H and oxidative phosphorylation.

Conclusion: This study identifies shared genes, pathways, immune alterations, and metabolic changes potentially contributing to the pathogenesis of both COVID-19 and AD.


Conflict of interest statement

The authors have declared that no competing interests exist.

Figures

Fig 1
Fig 1. Differential analysis and Gene ontology (GO) enrichment analysis of Alzheimer’s disease (AD) and COVID-19 patients.
(A) Intersection of differentially expressed genes (DEGs) upregulated by AD and COVID-19 (B) Intersection of DEGs downregulated by AD and COVID-19 (C) GO enrichment analysis for common upregulated genes (D) GO enrichment analysis for common downregulated genes.
Fig 2
Fig 2. Co-expression modules and enrichment analysis in patients with AD and COVID-19.
(A) The module–trait relationships in AD and COVID-19. Correlation analysis was performed using Pearson correlation within the WGCNA package. Correlation coefficients and corresponding p-values are provided for each module. (B) Correlation of black modules with AD (C) Correlation of black modules with COVID-19 (D) GO enrichment analysis for black module genes.
Fig 3
Fig 3. Co-diagnostic gene screening and machine learning modelling.
(A) Indicates the relationship between the number of decision trees and error rate. The black solid, red, and green dashed lines indicate the change in error rate with the number of decision trees for overall, Alzheimer’s, and COVID-19, respectively. (B) Plot of changes in gene importance scores based on the random forest algorithm. The horizontal axis indicates the importance of genes, and the vertical axis indicates genes with importance greater than 0.7. (C) Path diagram of Least Absolute Shrinkage and Selection Operator (LASSO) coefficients. The horizontal axis represents the logarithmic value of the regularisation parameter λ, and the vertical axis represents the value of the regression coefficient for each gene. Each curve represents the variation of the regression coefficient of a gene with λ. The numbers above indicate the number of non-zero coefficients at the corresponding λ values. (D) LASSO cross-validation curves. The horizontal axis indicates the logarithmic value of the regularisation parameter λ, and the vertical axis indicates the binomial deviation, which is used to measure the prediction error of the model. The red dots indicate the cross-validation error corresponding to each λ value, and the grey line indicates its standard error. The vertical dashed line on the left indicates the value of λ for the minimum deviation; the vertical dashed line on the right indicates the value of λ for the minimum deviation plus one standard error.
Fig 4
Fig 4. Immune cells and metabolic pathways in patients with AD and COVID-19.
(A) Infiltration of immune cells between AD and healthy samples (B) Immune infiltration analysis of 8 candidate genes in AD (C) Infiltration of immune cells between COVID-19 and healthy samples (D) Immune infiltration analysis of 8 candidate genes in COVID-19 (E) Correlation between the expression levels of 8 hub genes and the ssGSEA enrichment scores for classical metabolic pathways in the AD data (F) Correlation between the expression levels of 8 hub genes and the ssGSEA enrichment scores for classical metabolic pathways in the COVID-19 data. *p < 0.05, **p < 0.01, ****p < 0.001. The heatmap colors represent correlation coefficients between central genes and immune cells (Panels B and D) or enrichment scores (Panels E and F). Red (for AD) and orange (for COVID-19) indicate positive correlations, whereas blue (for AD) and green (for COVID-19) indicate negative correlation.
Fig 5
Fig 5. Process for quality control of single-cell data.
(A) The relationship among gene expression, cell counts, and mitochondrial content within individual samples. The values at the top of each panel represent the correlation coefficients between the variables shown on the axes. (B) Percentage of mitochondrial genes (mt), RNA features (nFeatureRNA), and RNA counts (nCountRNA) for each sample prior to filtration. (C) Percentage of mitochondrial genes (mt), RNA features (nFeatureRNA), and RNA counts (nCountRNA) for each sample after filtration (D) Principal component analysis (PCA) plot, with each dot representing a cell, alongside an elbow plot utilized to ascertain the number of principal components (PCs).
Fig 6
Fig 6. Single-cell subpopulation identification and expression levels of genes in AD patients and normal controls.
(A) UMAP visualization illustrating cell subpopulations in patients with AD (B) Ratio of immune cell composition in AD patients to normal subjects (C) Comparison of expression levels of core genes.
Fig 7
Fig 7. Co-localisation and differential expression of core genes in immune cells of AD patients.
(A) Proportion of core gene expression in immune cells of AD patients and normal subjects (B) Core gene expression in immune cells of AD patients and normal subjects (C) Co-localisation of oxidative phosphorylation metabolic pathways and EIF3H in AD patients and healthy subjects.

Similar articles

References

    1. Lu R, Zhao X, Li J, et al.. Genomic characterisation and epidemiology of 2019 novel coronavirus: implications for virus origins and receptor binding. Lancet. 2020. 395(10224): 565–574. doi: 10.1016/S0140-6736(20)30251-8 - DOI - PMC - PubMed
    1. Zhu N, Zhang D, Wang W, et al.. A Novel Coronavirus from Patients with Pneumonia in China, 2019. N Engl J Med. 2020. 382(8): 727–733. doi: 10.1056/NEJMoa2001017 - DOI - PMC - PubMed
    1. Vitiello A, Zovi A, Rezza G. New emerging SARS-CoV-2 variants and antiviral agents. Drug Resist Updat. 2023. 70: 100986. doi: 10.1016/j.drup.2023.100986 - DOI - PMC - PubMed
    1. Ye Q, Wang B, Mao J. The pathogenesis and treatment of the `Cytokine Storm’ in COVID-19. J Infect. 2020. 80(6): 607–613. doi: 10.1016/j.jinf.2020.03.037 - DOI - PMC - PubMed
    1. Chen L, Quach T. COVID-19 cytokine storm syndrome: a threshold concept. Lancet Microbe. 2021. 2(2): e49–e50. doi: 10.1016/S2666-5247(20)30223-8 - DOI - PMC - PubMed