. 2025 May;12(19):e2410776.
doi: 10.1002/advs.202410776. Epub 2025 Feb 18.

Deciphering Auditory Hyperexcitability in Otogl Mutant Mice Unravels an Auditory Neuropathy Mechanism

Affiliations

Deciphering Auditory Hyperexcitability in Otogl Mutant Mice Unravels an Auditory Neuropathy Mechanism

Mathilde Gagliardini et al. Adv Sci (Weinh). 2025 May.

Abstract

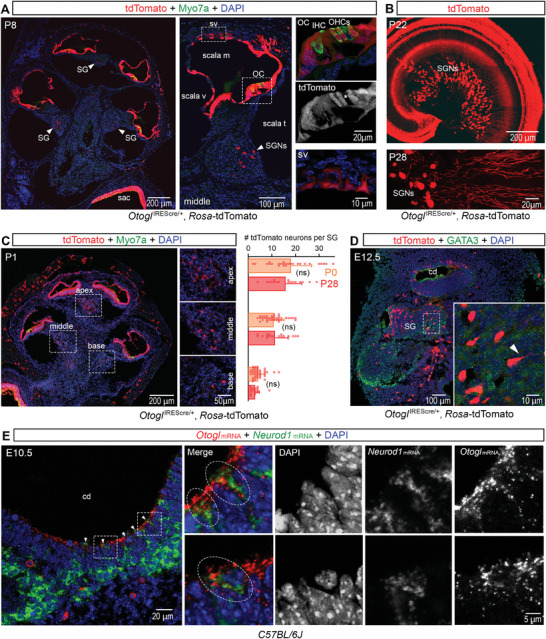
Auditory neuropathies affect the spiral ganglion neurons of the auditory nerve or their synapses with the sensory hair cells, distorting the sound information transmitted from the ear to the brain. Deciphering the underlying pathophysiological mechanisms remains challenging owing to the diversity of spiral ganglion neuron subtypes and associated central auditory circuits. An auditory neuropathy mechanism is unraveled by investigating the origin of auditory hyperexcitability in a mouse model for hereditary congenital deafness. Otogl encodes the large Otogelin-like protein, which is related to secreted epithelial mucins and is implicated in the mechanical stimulation of cochlear outer hair cells. Heterozygous Otogl+/- mutant mice display auditory hyperexcitability, highlighted by their susceptibility to audiogenic seizures induced by loud sounds. It is shown that Otogl is transiently expressed in a subpopulation of spiral ganglion neurons during cochlear development. Despite their apparently normal hearing, Otogl+/- mice display poor activation of the spiral ganglion neurons processing loud sounds and an elevation of the activation threshold of the middle the ear muscle reflex that attenuates loud sounds. The findings reveal how a neuropathy affecting spiral ganglion neurons specialized in loud sound processing and associated with the middle the ear muscle reflex can manifest itself as auditory hyperexcitability.

Keywords: Otogelin‐like; auditory neuropathy; low spontaneous rate spiral ganglion neurons; middle ear muscle reflex; reemerging auditory brainstem responses.


Conflict of interest statement

C.P. and P.A. are members of the scientific advisory board of Sensorion.

Figures

Figure 1
Figure 1
Audiogenic seizures in Otogl mutant mice. A, left) Proportion of Otogl +/+, Otogl +/−, and Otogl −/− mice displaying susceptibility to audiogenic seizures on P21–P28 and P35–P42. A, right) Distribution of onset latency for audiogenic seizures in Otogl +/+, Otogl +/−, and Otogl −/− mice on P21–P28. B, left) For electroencephalography (EEG) recordings, pins were implanted chronically at the surface of the auditory cortex (AC) and the inferior colliculus (IC) in head‐fixed awake animals. B, right) Individual examples of the electroencephalography (EEG) signal (sampling rate 5 kHz) obtained during an audiogenic seizure in an Otogl −/− mouse and during a tone presentation in an Otogl +/+ mouse. In silence, several isolated spontaneous fast ripples occurred with oscillations ≈250 Hz, in both the auditory cortex and inferior colliculus of Otogl −/−mice (bottom left box). When a tone at 10 or 14 kHz (depending on the animal) was presented at 105 dB SPL, an audiogenic seizure was induced despite the severe deafness of Otogl −/− mutant mice, and this seizure was characterized by an increase in the amplitude and duration of the ripples on EEG signal in both the auditory cortex and inferior colliculus (right box). The tone was stopped as soon as behavioural signs of the crisis became visible on the video recording of the animals. Ci) Graph showing the ratio of the spectrum during tone presentation to that in the 20 s before the tone in Otogl +/+ and Otogl −/− mice. In both areas, the increase in energy concerned principally the 150–500 Hz range. Frequency domains of significant difference with the 0 dB horizontal dashed line (p < 0.05) are indicated by horizontal bars. Cii) Percentage duration of ripples in Otogl +/+ and Otogl −/− mice before, during and after tone presentation. Ripples typically occupied 10% of the time in both brain areas, increasing to 30% of the time, on average, during tone presentation in Otogl −/− mutant mice. Numbers in brackets indicate the number of animals tested (A,C). AC, auditory cortex; EEG, electroencephalography; IC, inferior colliculus; ns, non‐significant.
Figure 2
Figure 2
Otogl is a marker of a population of SGNs within the cochlear nucleus. A) Diagram of the original Otogl‐IREScreERT2 genetic construct and the generation of Otogl‐IREScre through successive Dre and flippase DNA recombinations. Otogl IREScre/+:Rosa‐tdTomato mice were generated by crossing Otogl IREScre/+ mice with Rosa‐tdTomato mice expressing the red fluorescent protein tdTomato conditionally for fate mapping. B) Sagittal section of the cochlear nucleus (CN) of a P21 Otogl IREScre/+:Rosa‐tdTomato mouse immunostained for PV (green) (top), with a detailed view of the inset showing the bifurcation of the SGNs between the ascending and descending branches. C) Coronal section of the CN of a P28 Otogl IREScre/:Rosa‐tdTomato mouse along the posterior (left) to anterior (right) axis (top), with expanded views of the insets showing details of tdTomato‐positive neurons (bottom). Arrowheads indicate the presence of a series (left) and small bouquets (right) of tdTomato‐positive synaptic boutons. D) Enlarged view of the principal neurons of the CN from a P21 Otogl IREScre/+:Rosa‐tdTomato mouse immunostained for PV (green). Arrowheads indicate the presence of tdTomato‐positive synaptic boutons around the principal neurons of the CN. * indicates one of the principal neurons of the CN that is negative for PV and contacted by several tdTomato‐positive synaptic boutons. E) Coronal sections of the CN from a P21 Otogl IREScre/+:Rosa‐tdTomato mouse immunostained for the endbulb of Held synaptic marker synaptotagmin‐2 (green). Some endbulbs of Held are pinpointed by asterisks (middle and right panels). Arrowheads indicate tdTomato‐positive synaptic connections (right panel), which contact postsynaptic bushy cells but do not overlap with the endbulbs of Held. Cell nuclei are stained in blue (DAPI). a, anterior; AVCN, anteroventral cochlear nucleus; d, dorsal; DCN, dorsal cochlear nucleus; m, middle; PVCN, posteroventral cochlear nucleus; VCN, ventral cochlear nucleus.
Figure 3
Figure 3
Otogl is an early marker of a population of SGNs. A) Longitudinal cross‐section of the cochlea of a P8 Otogl IREScre/+:Rosa‐tdTomato mouse immunostained for Myosin7a (Myo7a) (green) (left) with an enlarged view of a cochlear canal (middle) and expanded views of the insets (right) showing details of tdTomato‐positive cells in the neurosensory epithelium, the organ of Corti (top right), and stria vascularis (bottom right). Arrowheads point to the spiral ganglia. * indicates an OHC with no tdTomato expression in the middle cochlear canal (middle right). B) Z‐projection of a cochlear whole mount from a P22 Otogl IREScre/+:Rosa‐tdTomato mouse (top) and acquisition of SGNs from a P28 Otogl IREScre/+:Rosa‐tdTomato mouse (bottom). C, left) Longitudinal cross‐section of the cochlea of a P1 Otogl IREScre/+:Rosa‐tdTomato mouse immunostained for Myosin7a (green) with an enlarged view of the apical, middle, and basal spiral ganglia. C, right) Bar graph comparing the number of tdTomato neurons per spiral ganglion between P0, when the cochlea has almost reached its final length but spontaneous and auditory‐elicited activity has not yet begun,[ 40 , 41 ] and P28, when the cochlea is mature in the apex, middle, and base of the cochlea in Otogl IREScre/+:Rosa‐tdTomato mice. D) Longitudinal cross‐section of the inner the ear of an E12.5 Otogl IREScre/+:Rosa‐tdTomato mouse embryo immunostained for GATA3 (green) with an enlarged view of neurons from the cochleo‐vestibular ganglion. The arrowhead points to a neuron with its axon. E, left) Coronal cross‐section of the otic vesicle of an E10.5 mouse embryo stained for Otogl (red) and Neurod1 (green) mRNA. E, right) Two highlighted regions with cells co‐expressing Otogl and Neurod1 are indicated by dashed ellipses. Cell nuclei are stained in blue (DAPI). cd, cochlear duct; IHC, inner hair cell; OC, organ of Corti; OHCs, outer hair cells; ov, otic vesicle; sac, saccule; scala m, scala media; scala t, scala tympani; scala v, scala vestibuli; SG, spiral ganglion; SGNs, spiral ganglion neurons; sv, stria vascularis; ns, non‐significant.
Figure 4
Figure 4
Molecular characterization of tdTomato‐positive neurons in Otogl IREScre/+:Rosa‐tdTomato mice. A) Z‐projections of the apical cochlear spiral ganglia of a P28 Otogl IREScre/+:Rosa‐tdTomato mouse immunostained for PV, Pou4f1, calb, or CR, or stained for Prph mRNA (top) with enlarged views of the insets showing details of SGNs (bottom). B) Bar graphs showing the percentage of tdTomato‐positive neurons positive for PV, the distribution of PV neurons positive for tdTomato at the apex, middle, and base of the cochlea, the percentage of tdTomato‐positive neurons also positive for Pou4f1, calb, CR, or Prph mRNA, and the percentage of tdTomato‐negative neurons positive for Pou4f1, calb, CR, or Prph mRNA. Cell nuclei are stained in blue (DAPI). Numbers in brackets indicate the number of neurons counted.
Figure 5
Figure 5
Elevated re‐ABR thresholds in Otogl +/− mutant mice. A) Graphs showing ABR thresholds (top left) and DPOAE levels (bottom left) in Otogl +/− and Otogl +/+ mice on P25. Bar graphs showing the timing of ABR waves I (top right) and V (bottom right) in Otogl +/− and Otogl +/+ mice. B) Example traces of ABR recordings in Otogl +/+ (top left) and Otogl +/− (top right) mice on P25 in response to 10 kHz pure tones at 85, 95 and 105 dB. Example traces of reABR recordings obtained from Otogl +/+ (bottom left) and Otogl +/− (bottom right) mice on P25 mice after increasing the 10 kHz probe tone by 10, 20, and 30 dB, after masking the classical ABR signal obtained in response to a 10 kHz probe tone at 75 dB with a ≈70 dB masker noise. Red asterisks indicate the almost total absence of re‐emerging wave I and V signals when the 10 kHz probe tone is increased by 10 dB. C) Bar graphs showing the wave I amplitude ratio (reABR/ABR) (left), the wave V amplitude ratio (middle), and the reABR wave timing (right) as a function of probe tone sound level increase. Numbers in brackets indicate the number of animals tested. ns, non‐significant.
Figure 6
Figure 6
Myelination is not altered in Otogl +/− mutant mice. A) Cochlear spiral ganglia section of P21 Otogl +/+ and Otogl +/− mice immunostained for MBP and the neurofilament protein NF200 (top) with enlarged views showing details of SGN cell bodies (bottom left) and axons (bottom right) for each genotype. B) Cochlear spiral ganglia section of P21 Otogl IREScre/+:Rosa‐tdTomato and Otogl IREScre/−:Rosa‐tdTomato mutant mice immunostained for MBP and NF200 (top) with enlarged views showing details of cell bodies (bottom left) and axons (bottom right) of tdTomato‐positive neurons (white) for each genotype. Arrowheads show examples of tdTomato‐positive axons (white) surrounded by MBP staining (red). C) Representative transmission electron microscopy acquisitions of P25 Otogl +/+ and Otogl +/− axons of spiral ganglion neurons (left). Bar graphs showing the axon diameter and the g‐ratio of SGNs, and distribution of g‐ratios in analysed neurons (right). Numbers in brackets indicate the number of neurons analyzed. ns, non‐significant.
Figure 7
Figure 7
Ribbon synapse functioning is not altered in Otogl mutant mice. A) Z‐projections of IHCs from cochlear whole mounts from P22 Otogl +/+, Otogl +/−, and Otogl −/− mice (left). Bar graphs showing the number of ribbon synapses per IHC in Otogl +/+, Otogl +/−, and Otogl −/‐ mice (right). B) Protocol used to depolarise IHCs from −95 mV to potentials between −65 mV to +35 mV, with examples of Ca2+ currents (I Ca) (left) and the corresponding Cm traces (right) for P25–P35 Otogl +/+, Otogl +/−, and Otogl −/− IHCs after 20 ms of depolarisation to −10 mV (left). Mean Ca2+ current amplitudes (I Ca) (middle) and ΔCm (right) for P25–P35 Otogl +/+, Otogl +/−, and Otogl −/− IHCs after 20 ms of depolarisation to potentials between −65 mV and +35 mV. C) Protocol used to depolarise IHCs from −95 mV to −10 mV for voltage steps of various durations from 2 to 50 ms (top). Kinetics of Ca2+‐dependent exocytosis in P25–P35 Otogl +/+, Otogl +/−, and Otogl −/− IHCs for voltage steps of 2 ms to 50 ms. Mean ΔCm is plotted against the duration of depolarisation to −10 mV (Δt). For the 2 and 5 ms depolarizations, the three repeated recordings were averaged, to increase the signal‐to‐noise ratio. D) Protocol used to elicit a train of 50 successive short depolarisations (duration 5 ms, interpulse interval 10 ms) to −10 mV (top) and plots of mean cumulative ΔCm as a function of stimulus number in response to the train of 50 successive short depolarisations in P25‐P35 Otogl +/+, Otogl +/−, and Otogl −/− IHCs (bottom). For each depolarisation, ΔCm was evaluated by averaging only the last 3 ms of Cm values for each interstimulus interval, to prevent contamination with the initial peaks. Numbers in brackets indicate the number of patched IHCs. ns, non‐significant.
Figure 8
Figure 8
Elevated re‐ABR thresholds in Otogl conditional knock‐out mice. A) Z‐projections of apical cochlear spiral ganglia cross‐sections from a P27 Bhlhb5 cre/+:Rosa‐tdTomato mouse immunostained for PV, Pou4f1, calb, or CR (top) with enlarged views of the insets showing details of SGNs (bottom). Bar graphs showing the percentage of tdTomato‐positive neurons also positive for PV (top) and the percentage of tdTomato‐positive neurons also positive for Pou4f1, calb, or CR (bottom). Cell nuclei are stained in blue (DAPI). B) Example traces of ABR recordings from P25 control Bhlhb5 +/+:Otogl lox/lox (top left) and Bhlhb5 cre/+:Otogl lox/lox (top right) in response to 10 kHz pure tones at 85, 95, and 105 dB. Example traces of reABR recordings obtained from P25 Bhlhb5 +/+:Otogl lox/lox (bottom left) and Bhlhb5 cre/+:Otogl lox/lox (bottom right) mice, after increasing the 10 kHz probe tone by 10, 20, and 30, with masking of the classical ABR signal obtained in response to a 10 kHz probe tone at 75 dB with a ≈70 dB masker noise. The red asterisk indicates the almost total absence of a re‐emerging wave I signal when the 10 kHz probe tone is increased by 10 dB. C) Bar graphs showing the wave I amplitude ratio (reABR/ABR) (top) and the wave V amplitude ratio (bottom) as a function of probe tone sound level increase in P25 Bhlhb5 +/+:Otogl lox/lox and Bhlhb5 cre/+:Otogl lox/lox mice. Numbers in brackets indicate either the number of probed neurons (A) or tested animals (C). ns, non‐significant.
Figure 9
Figure 9
Central auditory processing in Otogl +/− mutant mice. A) Auditory thresholds determined from ABRs in the range 2–48 kHz in Otogl +/− and Otogl +/+ mice. B) In vivo configuration for electrophysiological recordings with the implantation of a laminar microelectrode (black) in the inferior colliculus of 8 Otogl +/+ and 9 Otogl +/− mice. C) Spectrotemporal auditory receptive fields (STRFs) of inferior colliculus neurons in response to a 50 ms pure tone measured as firing rate as a function of tone frequency and time. The neural response was characterized by extracting from the STRF the bandwidth of the significant response area, the latency of the neural response, the maximum evoked firing rate and the baseline activity level (average firing rate in the 10 ms preceding the tone stimulation) as illustrated on this individual example. Di) Bar graphs showing the parameter values for STRFs obtained from the response to 75 dB SPL pure tones in Otogl +/− and Otogl +/+ mice. Distribution is indicated in grey. Dii) Bar graphs showing the variation of these parameters following the addition of background white noise at 85 dB SPL. Distribution is indicated in grey. E) Temporal processing in the inferior colliculus of Otogl +/− and Otogl +/+ mice. Example of a neural response to a 1 s click train at 30 Hz (top). ASSR was defined as the averaged response to each click (top). Graphs showing the mean firing rate over 1 s as a function of click rate (middle) and ASSR maximum firing rate relative to that of the first click (onset response), as a function of click rate (bottom). The latter function illustrates the progressive decrease in phase‐locking ability with increasing click rate. Numbers in brackets indicate the number of either animals tested (A, E) or recorded neurons (D). ns, non‐significant.
Figure 10
Figure 10
Abnormal MEMR in Otogl +/− mutant mice. A) Startle reflex amplitude as a function of the sound stimulus with a background of 45 dB white noise (left) and a background of 70 dB white noise (middle), and measurements of the gap inhibition startle reflex (right). B) Examples of DPOAE recordings in one the ear of Otogl +/+ (top left) and Otogl +/− (top right) mice, in the intermittent presence of a contralateral filtered white noise stimulus. The noise was played at different amplitudes to elicit the MEMR, for determination of its activation threshold. Graph of the mean MEMR (±SD) curve as a function of the noise elicitor level above an individually measured reflex threshold (bottom left) and bar graph showing the mean activation threshold of the MEMR (bottom right). Numbers in brackets indicate the number of animals tested. ns, non‐significant.

References

    1. Giraudet F., Avan P., Curr. Opin. Neurol. 2012, 25, 50. - PubMed
    1. Liberman M. C., Kujawa S. G., Hear. Res. 2017, 349, 138. - PMC - PubMed
    1. Starr A., Picton T. W., Sininger Y., Hood L. J., Berlin C. I., Brain J. Neurol. 1996, 119, 741. - PubMed
    1. Starr A., McPherson D., Patterson J., Don M., Luxford W., Shannon R., Sininger Y., Tonakawa L., Waring M., Brain J. Neurol. 1991, 114, 1157. - PubMed
    1. Kiang N. Y.‐S., Discharge Patterns Of Single Fibers In The Cat's Auditory Nerve, The MIT Press, Cambridge, MA, USA: 1965.

MeSH terms

Supplementary concepts

LinkOut - more resources