. 2025 Apr;12(14):e2417724.
doi: 10.1002/advs.202417724. Epub 2025 Feb 18.

The Crosstalk with CXCL10-Rich Tumor-Associated Mast Cells Fuels Pancreatic Cancer Progression and Immune Escape

Affiliations

The Crosstalk with CXCL10-Rich Tumor-Associated Mast Cells Fuels Pancreatic Cancer Progression and Immune Escape

Hanlin Yin et al. Adv Sci (Weinh). 2025 Apr.

Abstract

Pancreatic ductal adenocarcinoma (PDAC) is a devastating disease, necessitating approaches to improve prognosis. As the mediator of allergic process, mast cells have been found in various cancers and are associated with survival. However, the biological behaviors of tumor-associated mast cells (TAMCs) remain unclear. Herein, an excessive infiltration of TAMCs in PDAC is demonstrated, which apparently associated with poor survival in PDAC patients. PDAC cells are found to recruit CXCR2+ MCs into TME, and then inhibited MCs ferroptosis, and maintained their proliferation. Concomitantly, the tumor-derived exosome miR-188-5p activated the PTEN/AKT/GSK3β signaling, further stabilized transcriptional factor ERG by inhibiting its ubiquitin degradation, and finally enhanced the transcription of cxcl10 within TAMCs. In reverse, TAMCs-derived CXCL10 reversely promoted tumor epithelial-mesenchymal transition and induced immunosuppressive tumor microenvironment by recruiting CXCR3+ Tregs. Sodium cromoglycate (SCG) is a membrane stabilizer for MCs and confirmed as an effective and widely used agent to block TAMCs-derived CXCL10 and further sensitize the therapeutic efficacy of anti-PD-1 antibody plus gemcitabine for PDAC. These findings illuminate a critical and innovative crosstalk between TAMCs and PDAC cells that promote PDAC progression, and SCG sensitizes PDAC to the current immuno-chemotherapy, which reveals its potential to be a valuable adjuvant for PDAC patients.

Keywords: CXCL10; immune escape; pancreatic ductal adenocarcinoma; sodium cromoglycate; tumor‐associated mast cell.


Conflict of interest statement

The authors declare no conflict of interest.

Figures

Figure 1
Figure 1
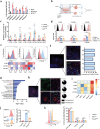
Mast cells excessively accumulate in PDAC tissues and correlate with poor prognosis. a) Mast cell infiltration analysis from transcriptome data of five PDAC tissues and paired adjacent normal tissues via CIBERSORT analysis. b) Representative images of TPSAB1 staining in PDAC tissues and adjacent normal tissues. Scale bar: 200µm. c) and d) Quantification and comparison of mast cells in tumor tissues and adjacent normal tissues from JHH (Johns Hopkins Hospital) cohort (c) and ZS (Zhongshan Hospital) cohort (d) by two‐sample t test and paired t test analysis, respectively. e) The Kaplan‐Meier plot of overall survival in PDAC stratified by mast cell density using CIBERSORT algorithm from TCGA database. f) and g) Kaplan‐Meier plot of overall survival (f) and recurrence free survival (g) in PDAC from the ZS cohort stratified by mast cells density. h) The visualization of independent prognostic factor for overall survival and recurrence free survival in the ZS cohort via multivariate Cox regression analysis.
Figure 2
Figure 2
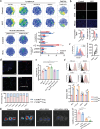
PDAC recruits mast cell infiltration and promotes its proliferation. a) Mast cell migration assay comparing the recruitment ability of tumor‐conditioned medium. Surgical resected PDAC tissues (n = 5) were digested into single cells and resuspended by DMEM. After culturing for 24h, supernatant was harvested as tumor‐conditioned medium. Anti‐CD117 was used at 10µg mL−1 to block SCF/CD117 signaling. b) Schematic representation of mast cell migration assay and qRT‐PCR analysis. Mast cells were inoculated into the upper chamber for 12 h and collected from both upper and lower chambers. c) Relative expression of chemokine receptors in migrated mMCs via qRT‐PCR analysis. The expression of chemokine receptors was calculated by ΔΔCTupper/ΔΔCTupper and normalized to control groups. n = 4 per group. d) Representative histogram and statistical analysis of CCR5, CXCR1, and CXCR2 expression on migrated hMCs via flow cytometry. n = 4 per group. e) Representative histogram images and normalized heatmap of chemokine receptor expression in tumor‐associated mast cells in PDAC (n = 5). Mast cells were gated on CD45+, CD117+, and FcεRI+. f) Representative immunofluorescence images of CXCR2 and TPSAB1 co‐staining in PDAC tissues and quantification for the ratio of CXCR2+TAMCs to total TAMCs. TPSAB1, green; CXCR2, red; DAPI, blue. Red arrow: CXCR2+TPSAB1 cells; White arrow: CXCR2+TPSAB1+ TAMCs; Green arrow: CXCR2TPSAB1+ MCs; Scale bars: 100µm. g) KEGG pathways were enriched based on DGEs from mast cells co‐cultured with tumor cells or not. h) Proliferated tumor‐associated mast cells were defined as Ki‐67+ TPSAB1+ double positive cells by immunofluorescence staining. TPSAB1, green; Ki‐67, pink; cytokeratin 19, orange; DAPI, blue. Scale bars: 50µm. i) Heatmap of proliferation‐related gene expressions from transcriptional RNA sequencing for mast cell following indicated treatments. j) Representative histogram of CFSE staining and the ratios of proliferative cells to total cells from indicated groups. n = 3 per group. mMCs were labeled by CFSE and stimulated by tumor‐conditioned medium or DMEM as control for 48 hours. k) Representative histogram of cell cycle staining and the statistical analysis of the percentage in each cell cycle phase from indicated groups. mMCs were stimulated by tumor‐conditioned medium or DMEM as control for 48 hours, and then stained by PI for cell cycle analysis. n = 4 per group. *P < 0.05, **P < 0.01, and ***P < 0.001, Data were displayed as mean ± SD.
Figure 3
Figure 3
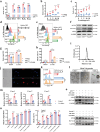
Tumor‐conditioned medium inhibits mast cell ferroptosis via AKT pathway activation. a) The death rate of indicated cells following treatment with different cell death inducers. RSL3: ferroptosis activator; Staurosporine(STS): apoptosis activator; hydrogen peroxide(H2O2): ROS stress inducer; Rapamycine(Rapa): autophagy inducer). Cells were pre‐treated by KPC‐conditioned medium or DMEM as control for 12 h, then stimulated by death inducers for 24 h, and stained by PI for evaluation of cell death. n = 5 per group. b) and c) The lipid ROS levels (b) and death rates (c) were compared between mast cells treated by KPC‐conditioned medium or not for 24 h. d) and e) Flow cytometry analysis for ROS levels (d) and Fe2+ levels (e) in mast cells following indicated treatments. n = 4 per group. f) Western blot analysis for ACSL4, SLC7A11, and GPX4 expression in mast cells after indicated treatment for 24 h. g) and h) Flow cytometry analysis for lipid ROS levels (n = 4). g) and cell death rates (n = 6). h) in mast cells after conditioned medium with or without exosomes. i) Histogram showing the diameter distribution of KPC‐derived exosomes. j) KPC‐derived exosomes were pre‐stained by PKH26 (membrane dye for cell‐tracing assay) and used for exosome intake assay by co‐culturing with mast cells. k) Flow cytometry analysis for mast cell proliferation by CFSE after indicated treatment for 48 hours. n = 4 per group. l) Representative image of three PDAC patient‐derived organoids. m) Mast cells co‐cultured with three patient‐derived organoids and then treated with Erastin to detect lipid ROS levels. n = 4 per group. n) The effect of AKT pathway inhibitors including MK‐2206 (AKT phosphorylation inhibitor, 3µM) and LY294002 (PI3K inhibitor, 10µM) on lipid ROS (left panel) and cell death rate (right panel) of mast cells after the treatment of Erastin and KPC‐conditioned medium. n = 4 per group. o) The expression of GPX4 and SLC7A11 in mast cells after they were pre‐treated with AKT inhibitors and stimulated by KPC‐conditioned medium (upper) or Panc02‐conditioned medium (lower). n.s. P > 0.05, *P < 0.05, **P < 0.01, and ***P < 0.001, Data were displayed as mean ± SD.
Figure 4
Figure 4
Tumor associated mast cell‐derived CXCL10 promotes tumor progression. a) Heatmap showing the significant changes of cytokines in both KPC and Panc02 educated mast cells by RNA‐seq. Mast cells were co‐cultured with tumor cells or stimulated by tumor‐conditioned medium for 24 hours. b) qRT‐PCR analysis for indicated cytokine transcriptions in mast cells that co‐cultured with KPC cells or not for 24 h. n = 4 per group. c) ELISA assay analysis for CXCL10 levels in mMCs supernatant after mMCs stimulated by indicated tumor‐conditioned medium. n = 4 per group. d) Flow cytometry analysis for CXCL10 expression in tumor‐infiltrating immune cells. The cell suspension was first gated by single cells and then CD45+CXCL10+ double positive cells were further divided into four types of immune cells according to the corresponding representative markers. CD68, macrophages; CD11c, dendritic cells; CD66b, neutrophils; c‐kit, mast cells. e) Flow cytometry analysis for CXCL10 expression in tumor‐infiltrating macrophages, dendritic cells, neutrophils and mast cells in PDAC tissues. The representative histogram (left) and relative normalized MFI expression (right) in four types of tumor‐infiltrating immune cells were displayed. f) Representative immunofluorescence staining of CXCL10 and TPSAB1 in PDAC tissues. TPSAB1, green; CXCL10, red; DAPI, blue. Green arrow: TAMCs; white arrow: tumor cells; orange arrow: other cells with CXCL10 positive expression. g) Schematic representation of mMC adoptive transfer in murine models. Blank: without MCs adoptive transfer; CXCL10NC: adoptive transfer MCs with negative control plasmid transfection; CXCL10sh1 and CXCL10sh2: adoptive transfer MCs with CXCL10 knockdown plasmid 1 and plasmid 2 transfection. h) Representative H&E staining and immunofluorescence staining for tumor‐infiltrating engineered mMCs labeled by GFP. The tumor tissues were collected after mMCs adoptive transferred for 24 or 48 hours. i) Kaplan‐Meier analysis of survival for orthotopic PDAC mice received mMCs adoptive transfer or not. Survival curves were analyzed by log‐rank tests. n = 8 per group. j) Tumor growth curves in KPC (left) and Panc02 (right) subcutaneous PDAC models with SCG intraperitoneal injection or PBS as control in C57BL/6. Student's t test was used for comparison. n = 6 per group. n.s. P > 0.05, *P < 0.05, **P < 0.01, and ***P < 0.001, Data were displayed as mean ± SD.
Figure 5
Figure 5
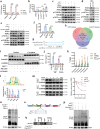
Tumor‐derived exosome miR‐188‐5p promotes CXCL10 transcription via PTEN/AKT/ERG axis in tumor‐associated mast cells. a) ELISA assay analysis for supernatant CXCL10 levels from tumor‐associated mast cells with or without AKT inhibitor pretreatment. n = 4 per group. b) ELISA assay analysis for supernatant CXCL10 level from tumor‐associated mast cells stimulated by conditioned medium with or without exosomes. n = 4 per group. c) Western blot analysis for AKT pathway activation in mast cells stimulated by normal or exosomes‐depleted KPC or Panc02 conditioned medium for 24 h. d) Western blot analysis for AKT pathway activation in tumor‐associated mast cells after miR‐188‐5p transfected. e) Western blot analysis for AKT pathway activation in tumor‐associated mast cells. KPC were transfected with miR‐188‐5p or negative control for 48h, and then the conditioned medium was harvested and used for mast cells stimulation. f) ELISA assay analysis for CXCL10 levels in tumor‐associated mast cell supernatant after indicated conditioned medium stimulation. n = 4 per group. miRi, miR‐188‐5p inhibitor. NC, negative control. g) The predicted binding site of miR‐188‐5p and PTEN 3′UTR region. h) Integrated bioinformatics analysis for potential transcriptional factors (TF) that could bind to Cxcl10 promoter. TSPP (https://www.signalingpathways.org/index.jsf) and UCSC (https://genome.ucsc.edu/) database were used for predicting TF binding to cxcl10 promoter. KnockTF (https://bio.liclab.net/KnockTF/search.php) were used for analyzing activated TF via different gene expressions. i) Western blot analysis for ERG nuclear translocation in tumor‐associated mast cells following AKT pathway inhibitor. j) ELISA assay analysis for CXCL10 levels in tumor‐associated mast cell supernatant after ERG knockdown by si‐RNA. n = 4 per group. k) ChIP‐PCR assay for ERG binding sites to Cxcl10 promoter following indicated treatments. n = 3 per group. l) Schematic representation of ERG binding sites in JARSPAR database (upper) and dual‐luciferase reported assay (lower) for binding sites identification. Student's t test was used for comparison. n = 4 per group. The difference of three mutated plasmids is described in Supplementary Figure 9D. m) Western blot analysis for the effect of tumor‐conditioned medium on the half‐life of ERG in tumor‐associated mast cells treated with CHX (100µg mL−1) for indicated incubation time. n) Western blot analysis for the effect of KPC and Panc02 conditioned medium on the ubiquitination level of ERG in mMCs. o) Schematic of the domain structure of ERG and the mutated site. p) The ubiquitination level of ERG T187A mutated protein after tumor‐conditioned medium stimulation in the presence of MG132 in mMCs. q) Western blot analysis for IP enriched cell lysates from mMCs. mMCs were transfected with Flag‐ERGWT, Flag‐ERGT187A for 48 hours and lysed for co‐IP assay. ERG was enriched by Flag antibody or isotype IgG as control. n.s. P > 0.05, *P < 0.05, **P < 0.01, and ***P < 0.001, Data were displayed as mean ± SD.
Figure 6
Figure 6
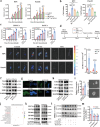
CXCL10 activates PDAC tumor migration and stemness by activating PPARγ. a) and b) Wounding assay (a) and transwell assay (b) analysis for KPC and Panc02 migration ability by co‐culturing with mast cell for 24 h associated with CXCL10 antibody or isotype IgG as control, or stimulating with rmCXCL10 (100ng mL−1) for 24 h. n = 4 per group. c) Quantification of migration ability by wounding scratch assay (n = 3) and transwell assay (n = 4) in CFPAC‐1 (left) and PANC‐1 (right) stimulated by rhCXCL10 (100ng mL−1) or not. d) Schematic for KPC and Panc02 orthotopic tumor models that received tumor surgical resection after mMCs adoptive transfer or SCG treatment. Recurrence or metastasis after surgical resection were evaluated by IVIS imaging system. e) Representative optical image in KPC and Panc02 murine models (left) with different treatments, and quantification analysis (right) of luciferase optical density. n = 5 per group. f) Western blot analysis for EMT‐related proteins in cancer cells treated with rhCXCL10 for 24 h. g) The representative image of immunofluorescence staining for ZEB1 in PDAC patient‐derived organoid slices after indicated treatments. h) Western blot analysis for stemness markers in cancer cells treated with rhCXCL10 for 24 h. i) Sphere formation assay analysis for PANC‐1 pre‐treated with rhCXCL10 or control for 24 h. n = 5 per group. j) KEGG functional enrichment analysis of DEGs between PANC‐1 stimulated by rhCXCL10 or not for 24 h. k) Western blot analysis for PPAR pathway in PANC‐1 and CFPAC‐1 stimulated by rhCXCL10 or not. l) Western blot analysis for PPARγ expression in the indicated cells. CXCR3 were knockdown by siRNA transfection in PANC‐1 and CFPAC‐1, and then stimulated by rhCXCL10 for 24 h. m) Dual‐luciferase assay analysis for PPAR transcriptional activity in PANC‐1 and CFPAC‐1 after rhCXCL10 stimulation. n = 5 per group. n.s. P > 0.05, *P < 0.05, **P < 0.01, and ***P < 0.001, Data were displayed as mean ± SD.
Figure 7
Figure 7
CXCL10 recruits CXCR3+ Tregs into microenvironment and SCG synergizes with gemcitabine plus αPD‐1. a) TSNE analysis for tumor‐infiltrating immune cells with or without SCG treatment and the proportions of these cells. KPC cell lines were orthotopically inoculated in C57BL/6 mice and received SCG treatment, tumor tissues were harvested at 20 days and analyzed by flow cytometry (n = 4). b) Dual‐fluorescence staining images and quantification of tumor‐infiltrating Treg in SCG treatment and control group. Foxp3, red; CD4, green; DAPI, blue. c) Flow cytometry analysis (left) and MFI quantitative analysis (right) of the CXCR3+ level on Treg in paired PMBCs and PDAC tissues. d) Dual‐fluorescence staining of CXCR3+ Treg in PDAC tissues (upper). CXCR3, red; FoxP3, green; DAPI, bule. The percentage of CXCR3+Treg in total tumor infiltrated Treg were calculated in seven PDAC patients (lower). e) Quantification of Treg proportions in migrated CD4+ cells recruited by mMCs‐conditioned medium with or without antibodies blockade in migration assay. Murine spleen was dissociated as single cells and added into upper chamber, indicated medium were then added into lower chamber for migration assay. n = 4 per group. f) Flow cytometry analysis for the level of exhausted markers in T cells when coculturing with CXCR3+ or CXCR3 Treg sorted by FACS. n = 3 per group. g) SCG was intraperitoneal injection at 75mg kg−1 for three times per week. Gemcitabine (20mg kg−1) plus αPD‐1 (100µg per mouse) were intraperitoneal injection once a week. 20 days after inoculation, luciferase activity was detected by IVIS imaging. Representative optical image (left) in KPC murine models and quantification (right) of luciferase optical density. n = 5 per group. n.s. P > 0.05, *P < 0.05, **P < 0.01, and ***P < 0.001, Data were displayed as mean ± SD.

References

    1. Siegel R. L., Giaquinto A. N., Jemal A., CA Cancer J Clin 2024, 74, 12. - PubMed
    1. van Weverwijk A., de Visser K. E., Nat. Rev. Cancer 2023, 23, 193. - PubMed
    1. Halbrook C. J., Lyssiotis C. A., Pasca di Magliano M., Maitra A., Cell 2023, 186, 1729. - PMC - PubMed
    1. Barry S. T., Gabrilovich D. I., Sansom O. J., Campbell A. D., Morton J. P., Nat. Rev. Cancer 2023, 23, 216. - PubMed
    1. a) Sun K., Li Y. Y., Jin J., Signal Transduct Target Ther 2021, 6, 79; - PMC - PubMed
    2. b) Galli S. J., Nakae S., Tsai M., Nat. Immunol. 2005, 6, 135. - PubMed

MeSH terms

LinkOut - more resources