. 2025 Mar 25;44(3):115294.
doi: 10.1016/j.celrep.2025.115294. Epub 2025 Feb 17.

Lung CD4+ resident memory T cells use airway secretory cells to stimulate and regulate onset of allergic airway neutrophilic disease

Affiliations

Lung CD4+ resident memory T cells use airway secretory cells to stimulate and regulate onset of allergic airway neutrophilic disease

Vijay Raaj Ravi et al. Cell Rep. .

Abstract

Neutrophilic asthma is a vexing disease, but mechanistic and therapeutic advancements will require better models of allergy-induced airway neutrophilia. Here, we find that periodic ovalbumin (OVA) inhalation in sensitized mice elicits rapid allergic airway inflammation and pathophysiology mimicking neutrophilic asthma. OVA-experienced murine lungs harbor diverse clusters of CD4+ resident memory T (TRM) cells, including unconventional RORγtnegative/low T helper 17 (TH17) cells. Acute OVA challenge instigates interleukin (IL)-17A secretion from these TRM cells, driving CXCL5 production from Muc5achigh airway secretory cells, leading to destructive airway neutrophilia. The TRM and epithelial cell signals discovered herein are also observed in adult human asthmatic airways. Epithelial antigen presentation regulates this biology by skewing TRM cells toward TH2 and TH1 fates so that TH1-related interferon (IFN)-γ suppresses IL-17A-driven, CXCL5-mediated airway neutrophilia. Concordantly, in vivo IFN-γ supplementation improves disease outcomes. Thus, using our model of neutrophilic asthma, we identify lung epithelial-CD4+ TRM cell crosstalk as a key rheostat of allergic airway neutrophilia.

Keywords: CD4(+) T cells; CP: Immunology; IFN-γ; MHC class II; T(H)17 cells; allergy; antigen presentation; epithelial cells; mucosal immunity; neutrophilic asthma; tissue-resident memory T(RM) cells.


Conflict of interest statement

Declaration of interests The authors declare no competing interests.

Figures

Figure 1.
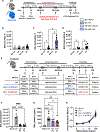
Figure 1.. Mouse model of allergic airway neutrophilic disease
(A) Schematic of experimental timeline used. (B) Representative images of hematoxylin and eosin-stained sections from mice (n = 3 mice) 8 h post-OVA challenge. (C–F) Total cell (C), macrophage (D), neutrophil (E), and lymphocyte (F) numbers in bronchoalveolar lavages (BALs) from mice at designated time points post-OVA challenge. Mann-Whitney test. (G) Representative dot plots depicting lung (ivCD45.2) neutrophils and eosinophils as fraction (%) of CD45+ cells 24 h post-OVA challenge; mean ± SD. (H) Numbers of lung (ivCD45.2) neutrophils and eosinophils 24 h post-OVA challenge. Mann-Whitney test. (I and J) Numbers of lung (ivCD45.2) neutrophils (I) and eosinophils (J) in no-LH (white dots) and LH mice (black dots) at baseline and 24 h post-OVA challenge. Two-way ANOVA with Fisher’s least significant difference (LSD) test. (K) Lung damage expressed as BAL protein content. Mann-Whitney test. (L) Scatterplot correlating lung neutrophil numbers and lung damage 24 h post-OVA challenge. Spearman’s correlation coefficient (r) and statistical significance are denoted. (M) Airway reactivity in response to increasing doses of methacholine in mice at baseline and 24 h post-OVA challenge as measured by Flexivent. The measurements represent maximum Rn values. Two-way ANOVA with Fisher’s LSD test. All data have n ≥ 5 mice, 2–3 experiments, mean ± SEM, and *p ≤ 0.05, **p ≤ 0.01, and ***p ≤ 0.001.
Figure 2.
Figure 2.. Diverse clusters of tissue-resident CD4+ TRM cells reside in lungs of mice with inhaled allergen history
(A–C) Levels of whole lung IL-17A (A), BAL CXCL5 (B), and lung damage (C) in mice 8 h post-OVA challenge. Mann-Whitney test. (D) Heatmap depicting Spearman’s correlation coefficients (r) and statistical significance for the specified correlations. (E) Representative contour plots depicting lung (ivCD45.2) CD4+ TRM cells identified as CD69+CD11ahigh CD4+ T cells in unchallenged mice. (F) Numbers of lung (ivCD45.2) CD4+ TRM cells in unchallenged mice. Mann-Whitney test. (G) Representative contour plots illustrating CD62L and CD44 levels on lung (ivCD45.2) CD4+ TRM cells (identified as CD69+CD11ahigh CD4+ T cells) in comparison to CD69CD11ahigh CD4+ T cells in unchallenged LH mice. (H) Schematic of experimental timeline and antibody panel used. (I) Phenograph clustering overlaid on opt-SNE projection depicting lung (i.v.CD45.2) CD4+ T cells concatenated from n = 8 LH mouse lungs on day 100. opt-SNE projection with heatmap visualization depicting CD44, CD62L, and CD11a expression levels is shown. (J) Heatmap depicting normalized expression levels of distinct molecules on lung (ivCD45.2) effector memory (CD62LCD44+CD11a+) CD4+ T cell clusters. The lineage-determining transcription factor (LDTF) status of each cluster is depicted on the right. (K) Relative abundance of each cluster in LH mice at day 100 is shown. (L) Frequencies of distinct memory TH cell lineages within lungs of LH mice at day 100. Positivity for a tested LDTF was determined using the cutoffs identified from clusters negative for that LDTF. *p ≤ 0.05, **p ≤ 0.01, ***p ≤ 0.001, and ****p ≤ 0.0001. All data have n ≥ 5 mice, 2 experiments, and mean ± SEM.
Figure 3.
Figure 3.. Allergen-experienced lungs include unconventional RORγtnegative/low TH17 TRM cells that drive rapid allergic airway neutrophilia
(A) Representative contour plots depicting IL-17A-producing CD4 and CD4+ T cells as identified from live lung (ivCD45.2) lymphocytes within single-cell suspensions of LH mouse lungs stimulated with PMA/ionomycin. (B) Relative frequency of IL-17A+ lung (ivCD45.2) CD4 and CD4+ T cells in no-LH and LH mice. One-way ANOVA with Fisher’s LSD test. (C) Absolute numbers of IL-17A+ lung (ivCD45.2) CD4 and CD4+ T cells in no-LH and LH mice. One-way ANOVA with Fisher’s LSD test. (D) Representative histograms and expression levels of RORγt in IL-17A-producing lung (ivCD45.2) CD4 and CD4+ T cells in LH mice. One-way ANOVA with Fisher’s LSD test. (E) Representative histograms and expression levels of IL-17A in IL-17A-producing lung (ivCD45.2) CD4 and CD4+ T cells in LH mice. One-way ANOVA with Fisher’s LSD test. Expression patterns of S. pneumoniae-specific lung (ivCD45.2) CD4+ T cells were included as a positive control for conventional TH17 signatures. (F) Schematic of experimental timeline used. (G) Bronchoalveolar lavage (BAL) CXCL5 in wild-type (WT) and IL-17A/F-knockout no-LH and LH mice 24 h post-OVA challenge. One-way ANOVA with Fisher’s LSD test. (H and I) Total neutrophil (H) and eosinophil (I) numbers in BALs from WT and IL-17A/F-knockout no-LH and LH mice 24 h post-OVA challenge. One-way ANOVA with Fisher’s LSD test. (J) t-SNE projection of scRNA-seq data depicting expression patterns for TH cell signature markers of interest as expressed by CD4+ T cells isolated from airway wall biopsies and peripheral blood of adult asthmatic and healthy humans as displayed on the interactive web portal: https://asthma.cellgeni.sanger.ac.uk/. *p ≤ 0.05, **p ≤ 0.01, ***p ≤ 0.001, and ****p ≤ 0.0001. All data in (A)–(I) have n ≥ 5 mice, 2 experiments, and mean ± SEM.
Figure 4.
Figure 4.. Muc5achigh airway secretory cells communicate with CD4+ T cells and neutrophils in inhaled-allergen-experienced lungs
(A) Representative histogram plots depicting surface expression patterns of MHC class II, costimulatory molecules CD40, CD80, and CD86, and coinhibitory molecules PD-L1 and PD-L2 on distinct epithelial cells from LH mice at baseline. (B) Heatmap depicting fold change in surface expression levels of specified APC-related molecules on distinct epithelial cells from LH mice 24 h post-OVA challenge normalized to their baseline counterparts. N.D., not detected above FMO control. Mann-Whitney test. (C and D) mRNA levels of Muc5ac (C) and CXCL5 (D) in fluorescence-activated cell-sorted epithelial cells isolated from LH mice 24 h post-OVA challenge. One-way ANOVA with Fisher’s LSD test. *p ≤ 0.05. (E) Representative immunofluorescent micrographs showing anatomical location of Scgb1a1+ secretory epithelial cells (green), CD4+ T cells (red), and Ly6G+ neutrophils (magenta) in LH lungs 8 h post-OVA challenge. DAPI (blue) was used as a counterstain to identify lung structures. Data represent n = 3 mice/time point, two experiments. (F–I) t-SNE projection of scRNA-seq data depicting expression patterns for designated markers of interest by different subsets of epithelial cells identified in airways of adult asthmatic and healthy humans as displayed on the interactive web portal: https://asthma.cellgeni.sanger.ac.uk/. All data in (B)–(D) have n = 4 mice, 2 experiments, and mean ± SEM.
Figure 5.
Figure 5.. Antigen presentation by epithelial cells governs CD4+ TRM cells in allergen-experienced lungs
(A) Schematic of experimental timeline and antibody panel used. (B) Phenograph clustering overlaid on opt-SNE projection depicting lung (ivCD45.2) effector memory (CD62LCD44+CD11a+) CD4+ T cells concatenated from MHC class IIfl/fl and MHC class IIΔEpi LH lungs on day 120. (C) Heatmap depicting normalized expression levels of distinct molecules on lung effector memory CD4+ T cell clusters. Lineage-determining transcription factor (LDTF) status of each cluster is depicted on the right. (D) Relative abundance of each cluster of lung effector memory CD4+ T cells in MHC class IIfl/fl and MHC class IIΔEpi LH mice at day 120. Two-way ANOVA with two-stage step-up method of Benjamini, Krieger, and Yekutieli to correct for multiple comparisons. False discovery rate (FDR) *q ≤ 0.05. (E) Cumulative frequencies for relative abundances of CD4+ TRM cells positive for specified LDTFs. Two-way ANOVA with Fisher’s LSD test. (F) Intracellular cytokine staining (ICS) profile of lung (i.v.CD45.2) and blood (i.v.CD45.2+) CD4+ T cells isolated from MHC class IIfl/fl and MHC class IIΔEpi LH mice on day 120 and stimulated with PMA/ionomycin ex vivo. Two-way ANOVA with Fisher’s LSD test. #p ≤ 0.05 comparison between lung and blood, *p ≤ 0.05 genotype-dependent comparison within lungs, Φp ≤ 0.05 genotype-dependent comparison within blood. (G) Airway reactivity in response to increasing doses of methacholine in mice at baseline as measured by Flexivent. The measurements represent maximum Rn values. Two-way ANOVA with Fisher’s LSD test. *p ≤ 0.05 and **p ≤ 0.01. All data have n ≥ 5 mice, 2–3 experiments, and mean ± SEM.
Figure 6.
Figure 6.. Lung epithelial MHC class II curtails severe allergic airway neutrophilia
(A) Schematic of experimental timeline. (B) Total neutrophil numbers in bronchoalveolar lavages (BALs) from MHC class IIfl/fl and MHC class IIΔEpi LH mice 24 post-OVA challenge. Mann-Whitney test. (C) Representative dot plots depicting lung (ivCD45.2) neutrophils and eosinophils as fraction (%) of CD45+ cells 24 h post-OVA challenge; mean ± SD. (D) Numbers of lung (ivCD45.2) neutrophils and eosinophils in MHC class IIfl/fl and MHC class IIΔEpi LH mice 24 h post-OVA challenge. Mann-Whitney test. (E) BAL CXCL5 in MHC class IIfl/fl and MHC class IIΔepi LH mice 24 h post-OVA challenge. Mann-Whitney test. (F) Lung damage expressed as BAL protein content. Mann-Whitney test. (G) Relative frequency of RORγtnegative/low IL-17A+ lung (ivCD45.2) CD4+ T cells in MHC class IIfl/fl and MHC class IIΔEpi LH mice. Mann-Whitney test. (H) CXCL5 released by mouse lung epithelial (MLE12) cells treated with tumor necrosis factor alpha (TNF-α) plus IL-17A with or without IFN-γ for 6 h. Unpaired t test. (I) BAL CXCL5 in C57BL/6J mice 7 h post-administration of specified cytokine cocktails. Mann-Whitney test. (J and K) BAL CXCL5 (J) and BAL (K) neutrophil numbers in MHC class IIΔEpi LH mice challenged with OVA plus vehicle or OVA plus IFN-γ 8 h post-challenge. Data are presented as the fold change over cage-mate MHC class IIfl/fl LH mice. Mann-Whitney test. *p ≤ 0.05 and **p ≤ 0.01. All data have n ≥ 4 mice, 2 experiments, and mean ± SEM.
Figure 7.
Figure 7.. IFN-γ suppresses allergic airway neutrophilia
(A) Schematic of experimental timeline. (B–D) Total numbers of alveolar macrophages (B), neutrophils (C), and eosinophils (D) in WT and IFN-γ-knockout no-LH and LH mice 24 h post-OVA challenge. One-way ANOVA with Fisher’s LSD test. Note: the y axes in (B)–(D) are adjusted to a similar scale to facilitate direct comparisons of airway inflammatory profiles. (E) Schematic of experimental timeline. (F) Total neutrophil numbers in BAL from mice 24 post-OVA challenge with specified treatment modalities. One-way ANOVA with Fisher’s LSD test. (G) Lung damage expressed as BAL protein content. One-way ANOVA with Fisher’s LSD test. (H) Airway reactivity in response to increasing doses of methacholine in mice 24 h post-OVA challenge with specified treatment modalities as measured by Flexivent. The measurements represent maximum Rn values. Two-way ANOVA with Fisher’s LSD test. *p ≤ 0.05, **p ≤ 0.01, ***p ≤ 0.001, and ****p ≤ 0.0001. All data have n ≥ 4 mice, 2–3 experiments, and mean ± SEM.

References

    1. Lambrecht BN, and Hammad H (2015). The immunology of asthma. Nat. Immunol. 16, 45–56. 10.1038/ni.3049. - DOI - PubMed
    1. Holgate ST, Wenzel S, Postma DS, Weiss ST, Renz H, and Sly PD (2015). Asthma. Nat. Rev. Dis. Prim. 1, 15025. 10.1038/nrdp.2015.25. - DOI - PMC - PubMed
    1. Hammad H, and Lambrecht BN (2021). The basic immunology of asthma. Cell 184, 2521–2522. 10.1016/j.cell.2021.04.019. - DOI - PubMed
    1. GBD 2015 Chronic Respiratory Disease Collaborators (2017). Global, regional, and national deaths, prevalence, disability-adjusted life years, and years lived with disability for chronic obstructive pulmonary disease and asthma, 1990–2015: a systematic analysis for the Global Burden of Disease Study 2015. Lancet Respir. Med. 5, 691–706. 10.1016/S2213-2600(17)30293-X. - DOI - PMC - PubMed
    1. Wenzel SE (2012). Asthma phenotypes: the evolution from clinical to molecular approaches. Nat. Med. 18, 716–725. 10.1038/nm.2678. - DOI - PubMed

MeSH terms