Clinical Trial
. 2025 May 7;74(6):983-995.
doi: 10.1136/gutjnl-2024-334026.

Multiomics analysis of immune correlatives in hepatocellular carcinoma patients treated with tremelimumab plus durvalumab

Affiliations
Clinical Trial

Multiomics analysis of immune correlatives in hepatocellular carcinoma patients treated with tremelimumab plus durvalumab

Yuta Myojin et al. Gut. .

Abstract

Background: Hepatocellular carcinoma (HCC) is a leading cause of cancer-related mortality. The combination of tremelimumab and durvalumab is now a standard treatment option for advanced HCC.

Objective: To study immune responses in HCC patients treated with tremelimumab and durvalumab.

Design: We treated 28 HCC patients with durvalumab, tremelimumab and locoregional therapies. We performed a high-dimensional multiomics analysis including whole exome sequencing, single-cell RNA seq, CO-Detection by indEXing, flow cytometry and multiplex cytokine/chemokine analysis of patients' blood and tumour samples and integrated this data to elucidate immune correlatives and response mechanisms. Mice with syngeneic HCC were treated with anti-PD-L1 plus anti-CTLA4 for hepatic lymphocytes, tumour-infiltrating lymphocytes and peripheral blood mononuclear cell analysis.

Results: The median overall survival was 19.2 months. Tumour tissue analysis revealed enhanced interferon responses, with stronger effects in responders. Gene set variation analysis indicated enhanced antigen presentation in responders. Spatial analysis revealed that non-responder tumours had higher numbers of Tregs located in neighbourhoods enriched with immune cells and expressed higher levels of ICOS and PD-1. Conversely, non-responder PD1+CD8+T in these Treg-enriched neighbourhoods expressed lower ICOS. Cell-communication analysis demonstrated that Treg-CD8+T interaction was enhanced in non-responder tissue. Peripheral blood analysis showed increased classical monocytes in responders and Tregs in non-responders. Treg-CD8+T interaction was confirmed in preclinical models. Finally, single-patient computational analysis from the all-across analysis was performed on 860 features, which led to the identification of multiomics feature sets including Treg features.

Conclusion: Our study provides a blueprint for in-depth analysis of immune correlates in immunotherapy studies and demonstrates the importance of Treg distribution in HCC.

Trial registration numbers: NCT02821754 and the EudraCT identifier: 2019-002767-98.

Keywords: CLINICAL TRIALS; HEPATOCELLULAR CARCINOMA; IMMUNOTHERAPY.


Conflict of interest statement

Competing interests: None declared.

Figures

Figure 1
Figure 1
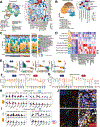
Study design and clinical outcome. (A) The Kaplan-Meier curve for PFS and OS in the NCT0282154 cohort (NIH cohort). (B) The Kaplan-Meier curve for PFS and OS of patients in the 2019–002767-98 cohort (Ireland cohort). (C) The swimmer plot of PFS and OS. The x-axis indicates the observation months from the day of the first treatment. (D) The list of samples of each patient used in the correlative study from the NCT0282154 cohort. NIH, National Institutes of Health; OS, overall survival; PD, progressive disease; PFS, progression-free survival; PR, partial response; SD, stable disease; TACE, trans arterial chemoembolisation.
Figure 2
Figure 2
Genetic correlative analysis of tumour tissue. (A) The heatmap showing the clinical background, mutations of baseline tumour tissue and HCC subclass by the gene expression. (B, C) The biopsy tissues at baseline (n=21) and post-treatment (n=10) were analysed with whole transcriptome sequencing. (B) Box plot showing GSVA results of IFNAP, antigen-presentation and TGF-b late signature. (C) Heatmap showing the prediction of cell composition in tissue analysed by cell-deconvolution methods (Kassandra). Precomparison and postcomparison were done for each cell type in each group. (D, E) The biopsy tissues at baseline (n=11) and post-treatment (n=10) were analysed with single-cell RNA sequencing (18 525 cells). (D) UMAP of major cell clusters. (E) Heatmap showing the surrogate markers of CD8+T cell, CD4+T cell, and Treg in R_BL, R-post, NR_BL, and NR_post. *: p<0.05 vs BL in post. #: p<0.05 vs R in NR. (B, C) One-way ANOVA test and ad hoc Turkey’s multiple comparison tests (E) Wilk-test were used, ns p>0.05, *p<0.05, **p<0.01, ***p<0.001, ****p<0.0001. ANOVA, analysis of variance; GSVA, gene set variation analysis; HCC, hepatocellular carcinoma.
Figure 3
Figure 3
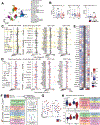
CD8T-Treg spatial interaction is enhanced in NR-post tissue. (A, B) UMAP of immune cells and non-immune cells. The marker expression of each cell type is shown in the heatmap. (C) The cell type composition of each slide. The right four bars show the summarised data for each group. (D) The heat map showing the enrichment of each cell type in each CN. (E) The bar plot shows fold change from BL to Post in R and NR in each cell type. (F) Box plot showing the OR of the CD8+T_PD1+in each CN. The significant difference is highlighted. (G) Box plot showing the OR of the CD4+T_FoxP3+in each CN. The significant difference is highlighted. (H, I) Violin plots showing relative marker expression of PD1 CD8 T+T cell and FoxP3+ CD4+T cell in CN2 and CN9. The number above the plot shows the KS score comparing R and NR calculated by the Kolmogorov-Smirnov test. (J) Representative image of post-treatment tissue in R and NR. The scale bar shows 20 µm. (F, G) *p<0.05 comparing R vs NR in BL, post and BL versus post in R and NR. Student’s t-test. BL, baseline; NR, non-responders; R, responders.
Figure 4
Figure 4
CD8T-Treg interactions were enhanced in non-responder (NR) tissue. Biopsy tissues at baseline (BL) (n=11) and post-treatment (n=10) were analysed by single-cell RNA sequencing (18 525 cells). Cell interactions were analysed using cell chat. (A) Scattered plots showing the strength of incoming and outgoing interactions of each cell type in each group; R-BL, NR-BL, R-post and NR-post. (B) Heatmap showing the differential number of interactions between R and NR in the BL and post in each cell type. The red colour indicates the interaction was enriched in NR. (C) Heatmap showing the outgoing and incoming signalling in R and NR in the BL and post in each cell type.
Figure 5
Figure 5
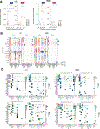
Peripheral immune cell and cytokine change after immunotherapy. (A–D) PBMC of BL (n=25) and C2D1 (post; n=24) were analysed with a spectral cytometer using a 24-antibody panel to detect different T cell subsets and a second 20-antibody panel for pan immune cells. (A) UMAP showing the unsupervised clustering in pan-immune cell panel and coloured by each cluster. (B) Box plot showing the ratio of each cluster to CD45+cells in each group. (C) Box plot showing the fold change from BL to post in paired samples (n=23). (D) Box plot showing the fold change from BL to Post in R (n=10) and NR (n=13). (E) Heatmap showing the relative cytokine concentration in each group. Four proteins (GM-CSF, FGF2, IL13, and IL17-A) were not detected in more than half of the samples and were, therefore, removed from the analysis. (F–H) Multiple features from the all-across analysis were integrated and analysed. (F) The outline of multiomic patient-based computational analysis. (G) Multiple features of each patient’s data were integrated and visualised with UMAP coloured with R and NR in BL and post-treatment. Each dot shows patients with multiomics features. (H) The violin plot showing the summary of enrichment scores in each condition. The feature set used for analysis is listed on the right coloured according to the multiomics modality. (B, E) One-way ANOVA test and ad hoc Turkey’s multiple comparison tests were used. (C, D) A paired t-test was used in each group. (H) An unpaired t-test was used. ns p>0.05, *p<0.05, **p<0.01, ***p<0.001. ANOVA, analysis of variance; BL, baseline; BMI, body mass index; NR, non-responders; PBMC, peripheral blood mononuclear cell.
Figure 6
Figure 6
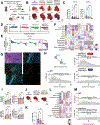
The preclinical model indicates Treg infiltration is related to the response to the therapy. (A–H) RIL175 and Hep55.1c were injected into the livers of female C57/BL6 mice. They were randomised on day 10 and treated with 10 mg/kg IgG control, anti-PDL1, anti-CTLA4, or anti-PDL1 plus anti-CTLA4 on 10, 15 and 20 days after tumour injection. IVIS tracking was performed using the RIL175 model 10, 13, 16 and 20 days after tumour injection. RIL175; IgG (n=15), anti-PDL1 (n=11), anti-CTLA4 (n=12), and anti-PDL1+anti-CTLA4 (n=16). Hep55.1c; IgG (n=5), anti-PDL1(n=5), anti-CTLA4 (n=5) and anti-PDL1+anti-CTLA4 (n=6). (A) Time course of treatment. (B) Representative macro image of the liver and tumour in each group. The scale bar is 1 cm. (C) Bar plot showing tumour weights of the RIL175 model and Hepp55.1c models. (D) Relative luciferase activity measured using IVIS in each mouse. (E) Bar plot showing the fold change in luciferase activity on day 20 compared with day 10 in each mouse. (F) Heatmap showing the relative immune cell ratio to CD45+cells in the tumour, liver and PBMC. A statistical test was performed for comparisons with the IgG group. (G, H) FFPE slides of RIL175 injected tumour-liver tissue were stained with CD8 (green) and FoxP3 (red) and the distance between CD8 positive cells to FoxP3 positive cells was measured. (G) Representative images of H&E staining and immunofluorescence. The scale bar shows 50 µm. (H) The bar plot showing the ratio of the CD8+T group, which was separated by the distance to the nearest Treg. (I) RIL175 was injected into the liver of female C57/BL6 mice. The mice were randomised on day 10 and treated with 10 mg/kg IgG control (n=6), anti-PDL1 (n=6), anti-CTLA4 (n=7), or anti-PDL1 plus anti-CTLA4 (n=7) on day 14. Bar plot showing the ratio of monocytes in CD45+cells, the ratio of ly6c high monocytes in monocytes, and MFI of MHCII and CD86 in monocytes. (J–M) RIL175 was injected into the livers of female C57/BL6 mice. They were randomised at day 10 and treated with IgG control (5 mg/kg, 4 times), anti-PDL1 (2.5 mg/kg, 4 times) plus anti-CTLA4 (2.5 mg/kg, 4 times) or anti-PDL1 (2.5 mg/kg, 4 times) plus anti-CTLA4 (10 mg/kg on day 10). (J) Representative macro image of the liver and tumour in each group. The scale bar shows 1 cm. (K) Bar plot showing tumour weight in each group. (L) Heatmap showing the relative immune cell ratio to CD45+ cells in the tumour and liver. A statistical test was performed for comparison with the IgG group. (M) The bar plot showing the ratio of the CD8+T group, which is separated by the distance to the nearest Treg. (C, E, I, K) One-way ANOVA test and ad hoc Turkey’s multiple comparison tests were used. (F, L). Two-way ANOVA test and ad-hoc Dunnett’s multiple comparison tests were used. ns p>0.05, *p<0.05, **p<0.01, ***p<0.001, ****p<0.0001. ANOVA, analysis of variance; FFPE, formalin-fixed paraffin-embedded.

References

    1. Siegel RL, Miller KD, Wagle NS, et al. Cancer statistics, 2023. CA Cancer J Clin 2023;73:17–48. - PubMed
    1. Singal AG, Kanwal F, Llovet JM. Global trends in hepatocellular carcinoma epidemiology: implications for screening, prevention and therapy. Nat Rev Clin Oncol 2023;20:864–84. - PubMed
    1. Llovet JM, Kelley RK, Villanueva A, et al. Hepatocellular carcinoma. Nat Rev Dis Primers 2021;7:6. - PubMed
    1. Finn RS, Qin S, Ikeda M, et al. Atezolizumab plus Bevacizumab in Unresectable Hepatocellular Carcinoma. N Engl J Med 2020;382:1894–905. - PubMed
    1. Abou-Alfa GK, Lau G, Kudo M, et al. Tremelimumab plus Durvalumab in Unresectable Hepatocellular Carcinoma. NEJM Evid 2022;1:EVIDoa2100070. - PubMed

Publication types

MeSH terms

Associated data