. 2025 Apr 14;35(4):686-697.
doi: 10.1101/gr.279049.124.

Long-read single-cell RNA sequencing enables the study of cancer subclone-specific genotypes and phenotypes in chronic lymphocytic leukemia

Affiliations

Long-read single-cell RNA sequencing enables the study of cancer subclone-specific genotypes and phenotypes in chronic lymphocytic leukemia

Gage S Black et al. Genome Res. .

Abstract

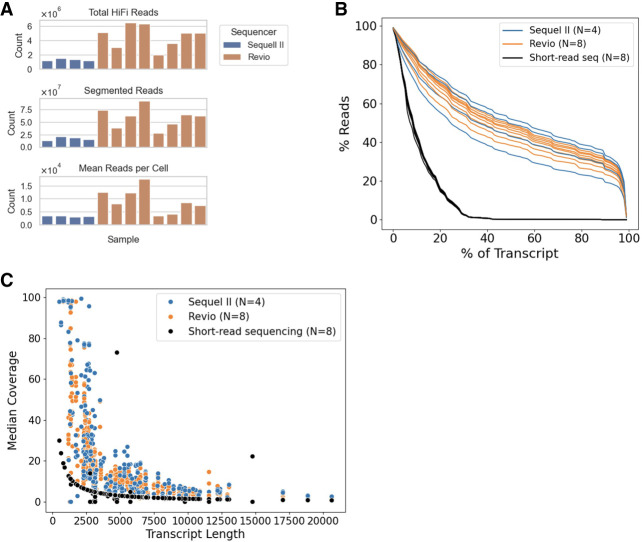
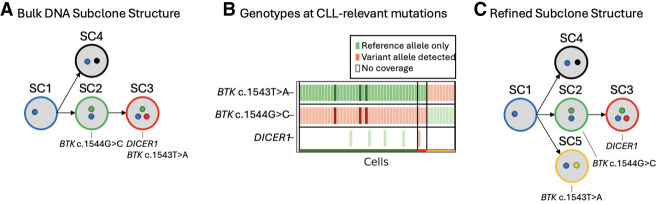
Bruton tyrosine kinase (BTK) inhibitors are effective for the treatment of chronic lymphocytic leukemia (CLL) due to BTK's role in B cell survival and proliferation. Treatment resistance is most commonly caused by the emergence of the hallmark BTK C481S mutation that inhibits drug binding. In this study, we aimed to investigate cancer subclones harboring a BTK C481S mutation and identify cells with co-occurring CLL driver mutations. In addition, we sought to determine whether BTK-mutated subclones exhibit distinct transcriptomic behavior when compared to other cancer subclones. To achieve these goals, we use scBayes, which integrates bulk DNA sequencing and single-cell RNA sequencing (scRNA-seq) data to genotype individual cells for subclone-defining mutations. Although the most common approach for scRNA-seq includes short-read sequencing, transcript coverage is limited due to the vast majority of the reads being concentrated at the priming end of the transcript. Here, we utilized MAS-seq, a long-read scRNA-seq technology, to substantially increase transcript coverage and expand the set of informative mutations to link cells to cancer subclones in six CLL patients who acquired BTK C481S mutations during BTK inhibitor treatment. In two patients who developed two independent BTK-mutated subclones, we find that most BTK-mutated cells have an additional CLL driver gene mutation. When examining subclone-specific gene expression, we find that in one patient, BTK-mutated subclones are transcriptionally distinct from the rest of the malignant B cell population with an overexpression of CLL-relevant genes.


Figures

Figure 1.
Figure 1.
Long-read scRNA-seq metrics. (A) Comparison of the total number of HiFi reads, the total number of segmented reads, and the mean reads per cell for each sample, colored by the sequencer used. (B) The canonical transcript coverage for each read aligning to a given gene is calculated for all protein-coding genes with at least one read aligned to it. The percentage of reads covering X% of the given transcript is plotted for each sample and colored by the sequencer used for the sample. Eight short-read samples are included in black for comparison. (C) Comparison of the median coverage from each sample for the 112 CLL driver genes included in this study. Genes are sorted along the x-axis by the length of the canonical transcript. Each dot represents the coverage of the given gene for a sample, colored by the technology used to sequence the sample.
Figure 2.
Figure 2.
The variant coverage provided by each scRNA-seq technology. (A) The overall variant coverage provided by the Sequel II and Revio compared to Illumina short reads. The percentage of cells covering each heterozygous germline variant in the patient's WES data is used to determine the percent of variants covered by at least X% of cells. (B) The variant coverage is binned by the variant's distance from the priming site, as indicated above each plot (bp = base pairs).
Figure 3.
Figure 3.
Overview of workflow to identify and use cell genotypes. (A) Predetermined subclone structures with accompanying somatic variant information are used to genotype individual cells in scRNA-seq data. Cells are assigned to a predetermined subclone based on the presence or absence of subclone-defining mutations. Subclone assignments are then used to group cells of the same subclone to identify subclone-specific gene expression. (B) Genotype matrix plots visualize the genotypes of all cells at each variant of interest, showing green for reference allele, red for alternate allele, and white for no coverage.
Figure 4.
Figure 4.
Visualization of single-cell genotypes to identify subclone structures. (A) The subclone structure of patient 1 was identified in the bulk DNA sequencing data. Subclones are depicted by the colored circles, with representative variant clusters inside each circle. The fishplot shows the prevalence of each subclone throughout treatment. (B) The cell genotypes at subclone-defining variants in patient 1. Each cell that was successfully assigned to a subclone is shown (x-axis), along with every somatic variant that was present in the WES data, labeled with the gene that the variant belongs to (y-axis). Green markers represent only reference alleles present in the scRNA-seq reads at the given variant location within the cell, and red markers indicate at least one scRNA-seq read in the cell contains the somatic variant allele. Darker marker coloring indicates an increased number of reads supporting that genotype. Variants and cells are grouped by their subclone assignment.
Figure 5.
Figure 5.
Refining the subclone structure of patient 3. (A) The subclone structure identified in the bulk DNA sequencing data of patient 3. CLL-relevant gene mutations are annotated under the subclone they are found in B. The genotype matrix plot from the relapse sample of patient 3 enables refinement of the original subclone structure. Each cell that was successfully assigned to a subclone is shown (x-axis), along with every CLL-relevant variant that was present in the WES data (y-axis). Green markers indicate that only reference alleles were present in the scRNA-seq reads at the given variant location within the cell, and red markers indicate that at least one scRNA-seq read in the cell contains the somatic variant allele. Darker coloring indicates an increased number of reads supporting that genotype. Only the CLL-relevant mutations are included for increased resolution to differentiate subclones. (C) The refined subclone structure that depicts the subclone containing the BTK c.1543T > A mutation is independent of the subclone containing the BTK c.1544G > C and DICER1 mutations.
Figure 6.
Figure 6.
Using cell assignments to identify subclone-specific gene expression patterns. The results shown are from patient 1, who had a linear pattern of subclonal evolution with a BTK mutation present in the final subclone. The pattern of subclonal evolution and genotype matrix plot for this patient are depicted in Figure 4. (A) Mapping subclone assignments to clustered cells enables the identification of phenotypically distinct subclones. (B) Heatmap of differentially expressed genes between the Original clone and the BTK-mutated subclone. The top 10 upregulated genes in each clone are shown. (C) Differential gene expression analysis between subclones illuminates overexpressed and underexpressed genes within the BTK-mutated subclone. (***) adjusted P-value < 0.001.
Figure 7.
Figure 7.
Using isoform expression analysis to complement gene expression analysis. The isoform expression analysis of the relapse sample of patient 1. (A) UMAP showing the isoform clustering. Mapping subclone assignments to clustered cells enables the identification of the same distinct clones identified in the gene expression analysis. (B) Heatmap showing differentially expressed isoforms between the Original clone and the BTK-mutated subclone. The top 10 upregulated isoforms for each clone are shown.

Update of

References

    1. The 1000 Genomes Project Consortium. 2015. A global reference for human genetic variation. Nature 526: 68–74. 10.1038/nature15393 - DOI - PMC - PubMed
    1. Al'Khafaji AM, Smith JT, Garimella KV, Babadi M, Popic V, Sade-Feldman M, Gatzen M, Sarkizova S, Schwartz MA, Blaum EM, et al. 2024. High-throughput RNA isoform sequencing using programmed cDNA concatenation. Nat Biotechnol 2: 582–586. 10.1038/s41587-023-01815-7 - DOI - PMC - PubMed
    1. Arruga F, Gizdic B, Serra S, Vaisitti T, Ciardullo C, Coscia M, Laurenti L, D'Arena G, Jaksic O, Inghirami G, et al. 2014. Functional impact of NOTCH1 mutations in chronic lymphocytic leukemia. Leukemia 28: 1060–1070. 10.1038/leu.2013.319 - DOI - PubMed
    1. Black GS, Huang X, Qiao Y, Tarapcsak S, Rogers KA, Misra S, Byrd JC, Marth GT, Stephens DM, Woyach JA. 2022. Subclonal evolution of CLL driver mutations is associated with relapse in ibrutinib- and acalabrutinib-treated patients. Blood 140: 401–405. 10.1182/blood.2021015132 - DOI - PMC - PubMed
    1. Brady SW, McQuerry JA, Qiao Y, Piccolo SR, Shrestha G, Jenkins DF, Layer RM, Pedersen BS, Miller RH, Esch A, et al. 2017. Combating subclonal evolution of resistant cancer phenotypes. Nat Commun 8: 1231. 10.1038/s41467-017-01174-3 - DOI - PMC - PubMed

MeSH terms

Substances

LinkOut - more resources