. 2025 Feb 19;10(1):64.
doi: 10.1038/s41392-025-02152-8.

Population-level analyses identify host and environmental variables influencing the vaginal microbiome

Affiliations

Population-level analyses identify host and environmental variables influencing the vaginal microbiome

Lang Qin et al. Signal Transduct Target Ther. .

Abstract

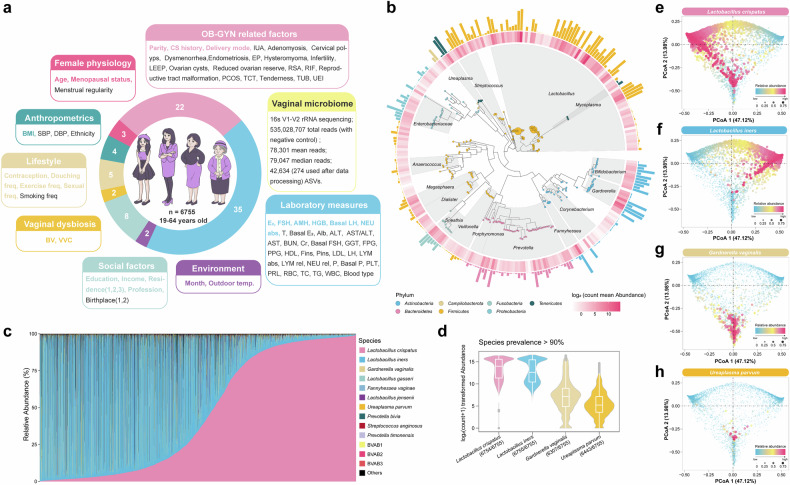
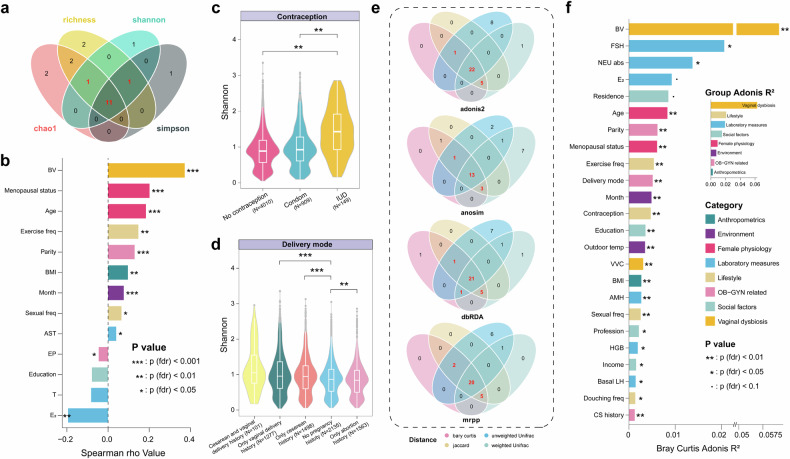
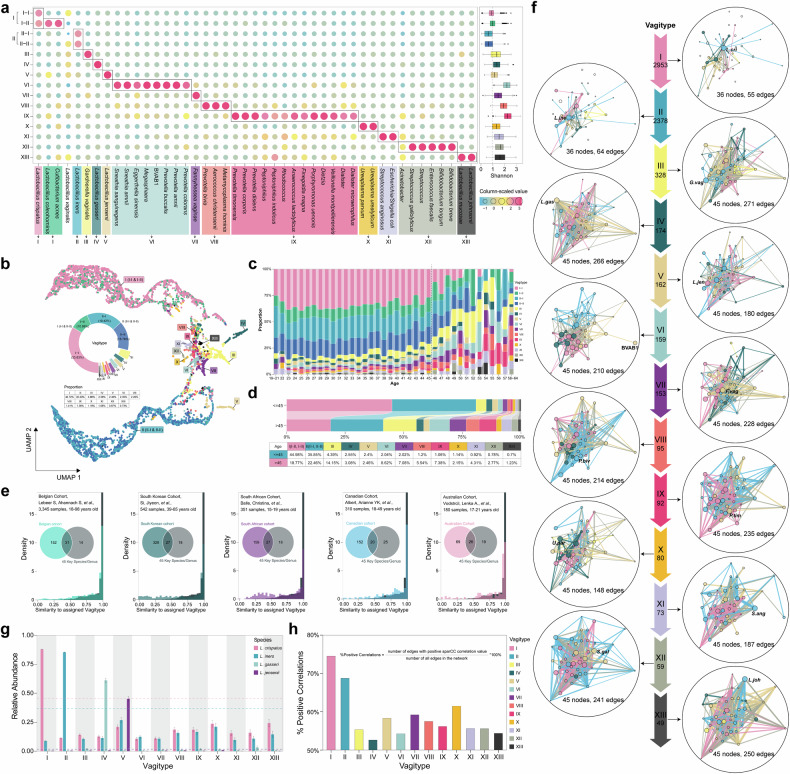
The vaginal microbiome is critical for the reproductive health of women, yet the differential impacts exerted by the host and by ambient environmental variables on the vaginal microbiome remain largely unknown. Here, we conducted a comprehensive cross-sectional study of the relationships between the vaginal microbiome and 81 matched host and environmental variables across 6755 Chinese women. By 16S rRNA sequencing, we identified four core vaginal microbiota with a prevalence of over 90% and a total median abundance of 98.8%. Twenty-four variables, including physiology, lifestyle behaviors, gynecologic history, social and environmental information, were found associated with the microbiome composition, of which bacterial vaginosis (BV) showed the largest effect size. Age was among the strongest explanatory variables and the vaginal microbiome dynamically succeeded with increasing age, especially with a composition turning point at the age of 45. Our mediation analyses indicated that the effects of age on the microbiome could be mediated by variables such as parity number and lifestyles. We further classified the vaginal microbiomes of the population into 13 "Vagitypes". Women with Lactobacillus iners- and Lactobacillus jensenii-dominated Vagitypes had significantly higher live birth rate than those with Vagitype dominated by Fannyhessea vaginae (53.40%, 59.09% vs 21.43%; OR [95% CI]: 3.62 [1.12-14.87], 5.39 [1.27-27.36]; P = 0.031, P = 0.021). This study provides a comprehensive overview of the associations between identified variables and the vaginal microbiome, representing an important step toward understanding of environment-microbe-host interactions.


Conflict of interest statement

Competing interests: The authors declare no competing interests.

Figures

Fig. 1
Fig. 1
Overview of the study and defining core vaginal microbiome in the VaMHP cohort. a 6755 individuals aged 19–64 years were recruited. Vaginal swabs with 81 time-matched variables from eight categories were collected. Wedge sizes in the ring chart reflect the proportion of collected variables in each category. b The phylogenetic tree constructed by the 274 representative sequences used in the study. The transparency of colors in the inner heatmap and the heights of bars in the outer ring correspond to the relative abundance of ASVs. The colors of bars in the outer ring represent the Phylum classification of microbes. The abundance of ASVs was transformed using a log2(count+1) function. c Relative abundances of top 13 taxa across all the individuals’ samples. Each sample is represented by one stacked bar. The bars for all samples were presented in the ascending order of relative abundance of Lactobacillus crispatus. “Others” refers to the remaining taxa. d The relative abundances of four core species that were observed in over 90% of the sampled participants. The abundances of the species were transformed by log2(count+1). eh Principal coordinate analysis (PCoA) plots based on Bray–Curtis distance. Each point represents a sample and is colored according to the relative abundance of specific bacterial taxa
Fig. 2
Fig. 2
Significant associations between microbiome diversity and host variables. a Venn diagram showing the continuous variables identified as significantly associated with four alpha-diversity measures. b Variables significantly associated with at least three alpha-diversity measures (FDR < 0.05), represented by Shannon index. Asterisks indicate FDR < 0.05 in the linear regression models. Each factor is colored by its category. BV Bacterial vaginosis, BMI Body mass index, AST Aspartate aminotransferase, EP Ectopic pregnancy, T Testosterone, E2 Estradiol. c, d Violin plots and boxplots showing the distribution of Shannon diversity in different categories of contraception and delivery mode. Comparisons were investigated by linear regression models adjusting for covariates (see “Methods”). For all boxplots, the central line, box and whiskers represent the median, interquartile range (IQR), and 1.5 times the IQR, respectively. *, **, ***: FDR < 0.05, 0.01, and 0.001. e Venn diagram showing the variables identified as significantly associated with inter-individual variations of the vaginal microbiome by ADONIS, ANOSIM, db-RDA, and MRPP analysis based on at least three of four beta-diversity metrics. f Significant variables associated with microbiome variation based on Bray–Curtis distance (FDR < 0.1 & Adonis R2 > 0.001). The bar plot indicates the explained variation of each variable. The inner image shows variance in microbiome composition explained by eight phenotype categories. BV bacterial vaginosis, FSH follicle stimulating hormone, Neu abs neutrophil absolute count, E2 estradiol, Residence participants’ city of residence, VVC Vulvovaginal candidiasis, BMI Body mass index, AMH Anti-mullerian hormone, Sexual freq Sexual frequency, HGB Hemoglobin, Basal LH Basal luteinizing hormone, Douching freq Vaginal douching frequency, CS history Cesarean section history
Fig. 3
Fig. 3
Identification of microbial taxa significantly associated with various variables. a Heatmap of the microbial taxa that were found to be significantly associated with different host or environmental variables using multivariate association with linear models (MaAsLin). Each level of every variable was compared with the reference level. Significant associations with FDR < 0.05 are marked with +/−. Blue and pink represent negative and positive correlations, respectively. BMI Body mass index, CS Cesarean section history, IUA Intrauterine adhesion, BV Bacterial vaginosis, VVC Vulvovaginal candidiasis, AMH Anti-mullerian hormone, E2 Estradiol, FSH Follicle stimulating hormone, Basal LH Basal luteinizing hormone, T Testosterone, HGB Hemoglobin. b SparCC network constructed by 45 identified microbial taxa. Microbial taxa are colored by phylum. The size of each node is proportional to relative abundance. Each edge represents a significant correlation with gray and yellow lines representing negative and positive correlations, respectively. The width of the edge indicates the strength of the sparCC correlation. The division of modules was calculated by the maximal greedy algorithm. c Zi-Pi plot showing the distribution of key species/genus based on their topological roles in the network. The threshold values of Zi and Pi for categorizing species/genus are 2.5 and 0.62, respectively. d Degree, closeness centrality, and betweenness centrality of each taxon in the network. The horizontal dashed line indicates the mean value for the degree of identified bacterial taxa
Fig. 4
Fig. 4
Dynamic variation of the vaginal microbiome across the different age groups. a Stack bar plot of the variation of average relative abundance of age-associated bacterial taxa across different age groups. The top 16 age-associated taxa determined by regression coefficient in MaAsLin are shown. The plot at the top denotes the average Shannon diversity of the age groups. b Relationships between age and the age-associated bacterial taxa. The Spearman correlations between the relative abundance of the top 16 age-associated taxa and age are shown as lines in the lower left region. The line width indicates the absolute value for the Spearman rho value. The line color indicates the direction of correlation (yellow for positive, gray for negative). The Pearson correlation between bacterial taxa is shown in the left plot. The size of the square in each cell is proportioned to the Pearson correlation r value. The dot plot at right indicates the mean relative abundance of taxa in women of different age groups (>45 vs. <=45). *, **, ***, **** indicate t-test P value < 0.05, 0.01, 0.001, 0.0001, respectively. c, d Microbiome networks of women in different age groups computed by sparCC. Analysis was conducted among 40 age-associated taxa determined by MaAslin. Nodes are colored according to the modules obtained from the maximal greedy algorithm within each network. The size of each node is proportional to the relative abundance of the taxa. Intra-module edges are colored by modules and inter-module edges are colored gray. The width of the lines reflects the strength of the correlations. e, f Degree of bacterial taxa of the microbiome network in different age groups. The taxa are ranked by the number of connections (i.e., degree). The horizontal dashed lines indicate the mean degree for bacterial taxa of the network in different age groups. gi Sankey diagram showing the causal relationship of age-host variables-bacteria inferred by mediation analysis (ACME FDR < 0.05 & Total Effect FDR < 0.05 & Sensitivity Analysis rho > 0). Age-associated bacterial taxa and age-associated host variables were included in the mediation analysis. The beta coefficient and significance are labeled at the edge and the proportions of the mediation effect are labeled at the center. ***, FDR < 0.001
Fig. 5
Fig. 5
The Vagitypes in the VaMHP cohort. a Assignment of vaginal Vagitypes based on 45 host or environment-associated microbial taxa. A total of 15 groups, 13 vaginal Vagitypes were identified. Marker taxa enriched in the specific Vagitype (determined by NMF) were in the same color. The boxplots indicate Shannon diversity in each Vagitype. The central line, box and whiskers of boxplots represent the median, interquartile range (IQR), and 1.5 times the IQR, respectively. b UMAP (Uniform Manifold Approximation and Projection) plot presenting the distinct clustering of the Vagitypes in the VaMHP cohort and the proportion of each Vagitype. c, d Distribution of Vagitypes in women of different ages and age groups (<=45 vs. >45). e Validation of the Vagitypes defined from the VaMHP cohort in five independent populations. The similarity of each sample to its assigned Vagitype centroid was computed using Yue and Clayton’s θ index, a similarity measure based on relative abundances of shared and non-shared species (θ = 0: complete dissimilarity, θ = 1: identical communities). The similarity of each sample to its assigned Vagitype centroid in five validation cohorts is plotted as colored, normalized histograms and is compared to that of the VaMHP cohort (gray histogram). The Venn plot showed the shared and exclusive taxa between the taxa identified in the validated cohort and 45 taxa identified in the VaMHP cohort. f Microbial interactions of the 13 Vagitypes. The network was constructed by 45 identified host or environment-associated key microbial taxa. Microbial taxa are colored by modules obtained from the maximal greedy algorithm within each network. The size of each node is proportional to its relative abundance. Intra-module edges are colored by modules and inter-module edges are colored gray. The width of the lines reflects the strength of the sparCC correlations. g The relative abundance of four main Lactobacillus species, L. crispatus, L. iners, L. gasseri, and L. jensenii across the 13 Vagitypes. The horizontal dashed lines indicated the mean relative abundance of L. crispatus and L. iners. h The percentage of the positive correlations of the network in each Vagitype
Fig. 6
Fig. 6
The relationship between BV, pregnancy outcome and vaginal microbiome variation. a Variation of average relative abundance of BV-associated bacterial taxa across different Nugent score groups. The top 16 BV-associated taxa determined by regression coefficient (absolute value) from MaAsLin are shown. The plot at the top denotes the average Shannon diversity across different Nugent score groups. b PCoA plot of samples with Nugent score 4–10 based on Bray–Curtis distance of microbial composition. The boxplots of PCo1 and PCo2 values of different Nugent groups are shown in the right and upper region. The central line, box and whiskers of boxplots represent the median, interquartile range (IQR), and 1.5 times the IQR, respectively. c Nugent score group distributions in different Vagitype. d Vagitype distributions in different BV groups. e, f Multivariate analysis for the IVF/ICSI outcome of live birth and clinical pregnancy in different Vagitypes. P values were calculated under a logistic regression model with Firth’s bias reduction method and adjusted for age, BMI, and the number of embryos transferred. OR odds ratio, CI confidence interval. g The total relative abundances of L. crispatus, L. iners, L. jensenii, and the live birth rate and clinical pregnancy rate across Vagitypes

References

    1. Human Microbiome Project, C. A framework for human microbiome research. Nature486, 215–221 (2012). - PMC - PubMed
    1. Ravel, J. et al. Vaginal microbiome of reproductive-age women. Proc. Natl Acad. Sci. USA108, 4680–4687 (2010). - PMC - PubMed
    1. Onderdonk, A. B., Delaney, M. L. & Fichorova, R. N. The Human Microbiome during Bacterial Vaginosis. Clin. Microbiol. Rev.29, 223–238 (2016). - PMC - PubMed
    1. Myer, L., Kuhn, L., Stein, Z. A., Wright, T. C. Jr & Denny, L. Intravaginal practices, bacterial vaginosis, and women’s susceptibility to HIV infection: epidemiological evidence and biological mechanisms. Lancet Infect. Dis.5, 786–794 (2005). - PubMed
    1. Brotman, R. M. et al. Bacterial vaginosis assessed by gram stain and diminished colonization resistance to incident gonococcal, chlamydial, and trichomonal genital infection. J. Infect. Dis.202, 1907–1915 (2010). - PMC - PubMed

Substances

LinkOut - more resources