. 2025 Feb 18;16(1):1752.
doi: 10.1038/s41467-025-56766-1.

Eukaryotic Elongation Factor 2 Kinase EFK-1/eEF2K promotes starvation resistance by preventing oxidative damage in C. elegans

Affiliations

Eukaryotic Elongation Factor 2 Kinase EFK-1/eEF2K promotes starvation resistance by preventing oxidative damage in C. elegans

Junran Yan et al. Nat Commun. .

Abstract

Cells and organisms frequently experience starvation. To survive, they mount an evolutionarily conserved stress response. A vital component in the mammalian starvation response is eukaryotic elongation factor 2 (eEF2) kinase (eEF2K), which suppresses translation in starvation by phosphorylating and inactivating the translation elongation driver eEF2. C. elegans EFK-1/eEF2K phosphorylates EEF-2/eEF2 on a conserved residue and is required for starvation survival, but how it promotes survival remains unclear. Surprisingly, we found that eEF2 phosphorylation is unchanged in starved C. elegans and EFK-1's kinase activity is dispensable for starvation survival, suggesting that efk-1 promotes survival via a noncanonical pathway. We show that efk-1 upregulates transcription of DNA repair pathways, nucleotide excision repair (NER) and base excision repair (BER), to promote starvation survival. Furthermore, efk-1 suppresses oxygen consumption and ROS production in starvation to prevent oxidative stress. Thus, efk-1 enables starvation survival by protecting animals from starvation-induced oxidative damage through an EEF-2-independent pathway.


Conflict of interest statement

Competing interests: JHH is a paid consultant for Surrozen, Inc. All other authors declare no competing interests.

Figures

Fig. 1
Fig. 1. ok3609 is a null allele of efk-1.
A Sequence map of efk-1 mRNA transcripts A and B, annotated with ok3609 deletion (generated using Exon-Intron Graphic maker by Nikhil Bhatla; www.wormweb.org/exonintron). Red, alpha-kinase domain; white, UTR; black, exons. Scale bar, 100 bases. B Western Blot (WB) of EEF-2 T56 phosphorylation (p-EEF-2), EEF-2, GFP, and tubulin in wild type (WT) and efk-1(ok3609) mutants with or without the rescue construct efk-1::GFP. Asterisk (*) denotes predicted protein size. N = 3; p-EEF-2 is quantified in Fig. S1B; for full membrane see Fig. S1A. C Reverse-transcription quantitative PCR (RT-qPCR) of efk-1 mRNA expression in WT and efk-1 mutants with or without the rescue construct efk-1::GFP. N = 4, center line denotes mean, box range denotes 25th-75th percentile, whiskers represent minimum/maximum, dots represent biological repeats; **p = 0.0029, ****p < 0.0001 (two-tailed unpaired t-test). D Schematic of the L1 starvation survival experiment. Created by BioRender. Yan, J. (2025) https://BioRender.com/d17w564. E The graph shows population viability (percent able to reach at least the L4 stage, y-axis) over time (days of L1 stage starvation, x-axis) of WT and efk-1(ok3609) mutants with or without the rescue construct efk-1::GFP. N = 4, error bars represent mean ± standard deviation (SD); ****p < 0.0001 percent L4 vs. WT animals (AUC compared using one-way ANOVA with Tukey’s multiple comparisons test). WT, wild-type; ns, not significant; AUC, area under the curve. Source data are provided as a Source Data file.
Fig. 2
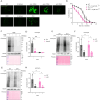
Fig. 2. EEF-2 T56 phosphorylation is unchanged in starving C. elegans.
A, B WB of p-EEF-2, EEF-2, tubulin, and eIF2α Ser51 phosphorylation (p-eIF2α) in WT and efk-1 mutants under the following conditions: A fed and 8-h starved in L4 stage larvae, and B overnight hatched (0 d), 4-days starved (4 d) and 9-days starved (9 d) at L1 stage. N = 4; p-EEF-2 and p-eIF2α quantified in Fig. S2A, B, D, E; for full membrane see Fig. S2C, F. C WB of p-EEF-2, EEF-2, and tubulin in WT L4 larvae either fed or under acute starvation for 5 min (5 m), 30 min (30 m), 1 h, and 2 h. N = 3; for whole membrane images, see Fig. S2H. D WB of p-EEF-2, EEF-2 and tubulin in overnight hatched and various fed conditions in L1-stage WT worms. Worms were either hatched without food, hatched in food, or hatched without food and refed for 8 h. N = 3; p-EEF-2 quantified in Fig. S2J; for full membrane see Fig. S2I. E WB of eEF2 T56 phosphorylation (p-eEF2), eEF2, tubulin, and eEF2K in A549 lung cancer cells in fed condition and after serum/glucose deprivation for 3, 6, and 24 h. N = 4; p-eEF2 quantified in Fig. S2K; for full membrane see Fig. S2L. WT, wild type.
Fig. 3
Fig. 3. efk-1 functions independently of altering global translation rate.
A Fluorescence micrographs of irg-1p::GFP reporter worms (L4 stage) after RNAi against various translation machinery components or treatment with 2 mg/ml cycloheximide for 3 h. For RNAi experiments, empty vector RNAi-expressing HT115 E. coli (EV) is used as control. Data shown are representative of three independent experiments. Scale bar, 200 µm. B The graph shows L1 starvation survival of WT and efk-1 mutants with or without supplementation of 10 µM cycloheximide (CHX). N = 4, error bars represent mean ± SD; ****p < 0.0001 percent L4 vs. WT animals (AUC compared using one-way ANOVA with Tukey’s multiple comparisons test). C, D WB and quantification of puromycin incorporation in A549 lung cancer cells. Cells were treated with 1 µg/ml puromycin for 10 minutes. 1 h of 2 µg/ml CHX is used as control. N = 3, error bars represent mean ± SD; ***p = 0.0004, ****p < 0.0001 (two-way ANOVA with uncorrected Fisher’s LSD); for full membrane see Fig. S2L. EH WB and quantification of puromycin incorporation in efk-1 mutants and WT both in E, F 8-h L4 starvation, and G, H 6-day L1 starvation. Worms were treated with 0.5 mg/ml puromycin for 3 h. 6 h of 2 mg/ml CHX is used as control. N = 3, error bars represent mean ± SD; for F, *p = 0.0232 for WT, *p = 0.0172 for efk-1 -CHX vs. +CHX; for H, *p = 0.0137 for WT, *p = 0.0441 for efk-1 -CHX vs. +CHX (two-way ANOVA with uncorrected Fisher’s LSD); for full membrane see Fig. S2M, N. WT, wild type; ns, not significant; AUC, area under the curve. Source data are provided as a Source Data file.
Fig. 4
Fig. 4. efk-1 promotes starvation survival independently of its kinase activity and of EEF-2 T56 phosphorylation.
A RT-qPCR of efk-1 mRNA expression in WT, efk-1(ok3609) null mutants, and two lines of efk-1 kinase-dead mutants, efk-1(ste2) and efk-1(ste3), referred to as efk-1(D257A) line 1 and line 2 respectively. N = 3, error bars represent mean ± SD; ***p = 0.0008 (one-way ANOVA with Tukey’s multiple comparisons test). B WB of p-EEF-2, EEF-2, and tubulin in fed L4 larvae of WT, efk-1 null mutants, and two lines of efk-1 kinase-dead mutants as described in A. N = 3; for whole membrane images, see Fig. S4B. C The graph shows L1 starvation survival of WT, efk-1(ok3609), and two lines of efk-1 kinase-dead mutants described in A. N = 3, error bars represent mean ± SD; **p = 0.002 percent L4 vs. WT animals (AUC compared using one-way ANOVA with Tukey’s multiple comparisons test). D WB of p-EEF-2, EEF-2, and tubulin in fed day-one adults of WT and eef-2(ste1) mutants bearing an EEF-2 T56A phosphosite mutation, denoted as eef-2(T56A). N = 3; for whole membrane images, see Fig. S4D. E The graph shows L1 starvation survival of WT and eef-2 phosphosite-dead mutants as described in D. N = 3, error bars represent mean ± SD; percent L4 vs. WT animals (AUC compared using two-tailed unpaired t-test). WT, wild type; ns, not significant; AUC, area under the curve. Source data are provided as a Source Data file.
Fig. 5
Fig. 5. The TFs zip-2 and cep-1 are required in the efk-1 pathway for starvation survival.
A The graph shows L1 starvation survival of WT, efk-1, zip-2(tm4248), cebp-2(tm5421), and cep-1(gk138) single mutants. N = 3, error bars represent mean ± SD; ***p = 0.0003, ****p < 0.0001 percent L4 vs. WT animals (AUC compared using one-way ANOVA with Dunnett’s multiple comparisons test). BD The graphs show the L1 starvation survival of B efk-1;zip-2, C efk-1;cep-1 and D zip-2;cep-1 double mutants alongside the respective single mutants. N = 3 for B, N = 4 for C, D, error bars represent mean ± SD; for B, **p = 0.0018 zip-2 vs. WT, ****p < 0.0001 efk-1 or efk-1;zip-2 vs. WT, #p = 0.0262 efk-1;zip-2 vs. zip-2; for C, **p = 0.0022 efk-1 vs. WT, ***p = 0.0006 cep-1 vs. WT, ***p = 0.0003 efk-1;cep-1 vs. WT; for D, *p = 0.0129 efk-1 vs. WT, *p = 0.0246 cep-1 vs. WT, *p = 0.0189 zip-2;cep-1 vs. WT percent L4 animals (AUC compared using one-way ANOVA with Tukey’s multiple comparisons test). E The graph shows L1 starvation survival of wild-type worms and efk-1 mutants with or without integrated zip-2::GFP overexpression constructs wgIs432 and jyIs29. N = 4, error bars represent mean ± SD; *p = 0.0175, ****p < 0.0001 percent L4 vs. WT animals, ##p = 0.006 vs. efk-1 animals (AUC compared using one-way ANOVA with Tukey’s multiple comparisons test). F The graph shows L1 starvation survival in WT, two independent transgenic lines of efk-1(ok3609);cep-1p::cep-1::3xFLAG animals, and respective non-GFP siblings. N = 5 for WT, N = 4 for all other groups, error bars represent mean ± SD; **p = 0.0028, ***p = 0.0001 percent L4 vs. WT animals, #p = 0.0111, ##p = 0.0025 vs. respective non-GFP siblings (AUC compared using one-way ANOVA with Tukey’s multiple comparisons test). WT, wild type; ns, not significant; AUC, area under the curve. Source data are provided as a Source Data file.
Fig. 6
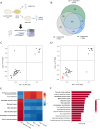
Fig. 6. DNA repair pathways are upregulated in WT and attenuated in efk-1, zip-2, and cep-1 mutants during starvation.
A Scheme of the RNA sequencing experiment (N = 3). Created in BioRender. Yan, J. (2025) https://BioRender.com/d17w564. B The Venn diagram shows the overlap between efk-1, zip-2, and cep-1 dependent genes (p < 0.005, FDR < 0.05 in starved WT, but not in the respective mutant). The central intersection contains 606 efk-1, zip-2, and cep-1 dependent genes (p < 0.005, FDR < 0.05 in starved WT, but not in any of efk-1, zip-2, or cep-1 mutants). See Supplementary Data 1. C, D The figure shows the correlation of KEGG pathways altered in efk-1, zip-2, and cep-1 null mutants (pval < 0.25) by GSEA, especially downregulation of DNA repair (highlighted in red). x = ES (x), y = ES (y). n = 41, r2 = 0.83, p < 2.2e-16 for zip-2 vs. efk-1; n = 37, r2 = 0.87, p < 2.2e-16 for cep-1 vs. efk-1. See Supplementary Data 2. E The heatmap shows the most significantly altered pathways in efk-1, zip-2, and cep-1 mutants relative to WT (pval < 0.05, padj < 0.05, |ES| > 0.5 in all datasets) by GSEA. Colors represent ES. See Supplementary Data 2. F The bar plot shows functionally enriched categories in the 606 efk-1, zip-2, and cep-1 dependent genes (pval < 0.005, padj < 0.0001) by ORA. Colors represent -log10(pval). DNA repair-related pathways are bolded. See Supplementary Data 3. ES, enrichment score; GSEA, gene set enrichment analysis; FDR, false discovery rate; KEGG, Kyoto Encyclopedia of Genes and Genomes; ORA, overrepresentation analysis; pval, p-value; padj, adjusted p-value.
Fig. 7
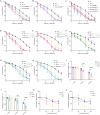
Fig. 7. NER is required for efk-1 mediated starvation resistance.
AC The graphs show L1 starvation survival for A TC-NER deficient csa-1(tm4539) and csb-1(ok2335) mutants, B GG-NER deficient xpc-1(tm3886) mutants, and C generally NER deficient xpa-1(ok698), xpf-1(tm2842), xpg-1(tm1670) and ercc-1(tm1981) mutants. WT and efk-1 controls shown are of the same experiments. N = 4, error bars represent mean ± SD; **p = 0.0017 efk-1 vs. WT, **p = 0.0022 csb-1 vs. WT, **p = 0.004 xpc-1 vs. WT, **p = 0.002 xpa-1 vs. WT, ***p = 0.0001 xpf-1 vs. WT, ***p = 0.0006 xpg-1 vs. WT, ****p < 0.0001 ercc-1 vs. WT percent L4 animals (AUC compared using one-way ANOVA with Dunnett’s multiple comparisons test). DH The graphs show L1 starvation survival of D efk-1;xpa-1, E efk-1;xpf-1, F cep-1;xpf-1, G zip-2;xpa-1, and H zip-2;xpf-1 double mutants alongside respective single mutants and WT control. N = 4, error bars represent mean ± SD; ****p < 0.0001; for E, **p = 0.0001 xpf-1 vs. WT, #p = 0.0109 efk-1;xpf-1 vs. xpf-1; for F, **p = 0.0025 xpf-1 vs. WT, ***p = 0.0002 cep-1 vs. WT; for G, *p = 0.0184 xpa-1 vs. WT, *p = 0.0493 zip-2;xpa-1 vs. WT; for H, **p = 0.0017 xpf-1 vs. WT, ***p = 0.0004 zip-2 vs. WT, ***p = 0.0001 zip-2;xpf-1 vs. WT percent L4 animals (AUC compared using one-way ANOVA with Tukey’s multiple comparisons test). IJ The graphs show UV-C larval survival of efk-1 and cep-1 mutants, as measured by recovery to L4 stage after UV-C irradiation (0-20 J/m2) at L1, normalized to no UV control. WT and xpa-1 controls shown are of the same experiment. N = 4, error bars represent mean ± SD; for I, *p = 0.0166, **p = 0.0021; for J, **p = 0.0096; ****p < 0.0001 (two-way ANOVA with Dunnett’s multiple comparisons test). K, L The graphs show UV-C induced embryo lethality of efk-1 and cep-1 mutants, as measured by percentages of viable embryos (24 h post egglay) after parents were subjected to UV-C irradiation (0-120 J/m2) at young adult stage. WT and xpa-1 controls shown are of the same experiment. N = 4, error bars represent mean ± SD; for K, *p = 0.0367 efk-1 vs. WT, ***p = 0.0001 xpa-1 vs. WT at 40 J/m2, ***p = 0.0003 xpa-1 vs. WT at 80 J/m2; for L, *p = 0.0221 efk-1 vs. WT at 40 J/m2; ****p < 0.0001 (two-way ANOVA with Dunnett’s multiple comparisons test). WT, wild type; ns, not significant; AUC, area under the curve. Source data are provided as a Source Data file.
Fig. 8
Fig. 8. BER is required for efk-1 mediated starvation resistance.
A The graph shows L1 starvation survival for WT, efk-1, and BER-deficient apn-1(tm6991), exo-3(tm4374), nth-1(ok724), ung-1(tm2862), and parp-2(ok344) mutants. N = 4, error bars represent mean ± SD; *p = 0.0222 ung-1 vs. WT, **p = 0.0042 exo-3 vs. WT, ***p = 0.0003 apn-1 vs. WT, ***p = 0.0008 nth-1 vs. WT, ****p < 0.0001 efk-1 or parp-2 vs. WT percent L4 animals (AUC compared using one-way ANOVA with Dunnett’s multiple comparisons test). BD The graphs show L1 starvation survival of B efk-1;apn-1, C efk-1;exo-3 and D efk-1;parp-2 double mutants alongside respective single mutants and WT control. N = 4, error bars represent mean ± SD; for B, **p = 0.0012 apn-1 vs. WT, ***p = 0.0002 efk-1;apn-1 vs. WT, ****p < 0.0001 efk-1 vs. WT; for C, **p = 0.0022 exo-3 vs. WT, ****p < 0.0001 efk-1 or efk-1;exo-3 vs. WT, #p = 0.0487 efk-1;exo-3 vs. exo-3; for D, ***p = 0.0005 efk-1 vs. WT, ****p < 0.0001 parp-2 or efk-1;parp-2 vs. WT, #p = 0.0162 parp-2 vs. efk-1;parp-2, ##p = 0.02 efk-1 vs. efk-1;parp-2 percent L4 animals (AUC compared using one-way ANOVA with Tukey’s multiple comparisons test). WT, wild-type; ns, not significant; AUC, area under the curve. Source data are provided as a Source Data file.
Fig. 9
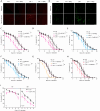
Fig. 9. efk-1 mutants are sensitive to starvation-induced oxidative stress.
A, B The micrographs show ROS content in freshly hatched and day 6 starved WT and efk-1 mutants with or without 5 mM NAC, as represented by superoxide dyes A dihydroethidium (DHE) and B CellROX Green. N = 3 (total 100 ~ 120 live worms per condition). Data are quantified in Fig. S9A–D. Scale bar, 100 µm. C, D The graphs show L1 starvation survival of WT and efk-1 mutants with or without supplementation of antioxidants C NAC and D VitC at 5 and 2.5 mM, respectively. WT and efk-1 controls shown are of the same experiments. N = 3, error bars represent mean ± SD; for C, **p = 0.0051 untreated efk-1 vs. WT, **p = 0.0076 treated vs. untreated efk-1; for D, **p = 0.0011 untreated efk-1 vs. WT, *p = 0.0488 treated vs. untreated efk-1 (AUC compared using one-way ANOVA with Tukey’s multiple comparisons test). EH The graphs show L1 starvation survival of WT, E zip-2, F cep-1, G xpa-1 or H xpf-1 mutants with or without supplementation of 5 mM NAC. WT and WT + NAC controls shown are of the same experiments between E, F and G, H. N = 4, error bars represent mean ± SD; for E, **p = 0.0016 untreated zip-2 vs. WT, *p = 0.0181 treated vs. untreated zip-2; for F, ***p = 0.0006 untreated cep-1 vs. WT, **p = 0.0053 treated vs. untreated cep-1; for G, **p = 0.0015 untreated xpa-1 vs. WT, **p = 0.0016 treated vs. untreated xpa-1; for H, **p = 0.0087 untreated xpf-1 vs. WT, **p = 0.0074 treated vs. untreated xpf-1 (AUC compared using one-way ANOVA with Tukey’s multiple comparisons test). I The graph shows larval UV-C survival (y-axis) of WT and efk-1 mutants (black, mock treatment; red, 10 J/m2 UVC) after pretreatment with starvation of up to 9 days (x-axis). N = 3, error bars represent mean ± SD (AUC of mock treatment vs. UV-C compared using one-way ANOVA with Tukey’s multiple comparisons test). WT, wild-type; ns, not significant; ROS, reactive oxygen species; NAC, N-acetylcysteine; VitC, Vitamin C (ascorbic acid); AUC, area under the curve. Source data are provided as a Source Data file.
Fig. 10
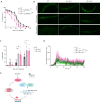
Fig. 10. efk-1 mutants exhibit mitochondrial defects in starvation.
A The graph shows L1 starvation survival of WT and efk-1 mutants with or without supplementation of mitochondrial antioxidant MitoQ at 5 µM. N = 4, error bars represent mean ± SD; ***p = 0.0006, ****p < 0.0001 (AUC compared using one-way ANOVA with Tukey’s multiple comparisons test). B, C Assessment of muscle mitochondria morphology in WT and two lines bearing an identical ok3609 mutation, efk-1(ste4) and efk-1(ste5), referred to as efk-1 line 1 and line 2, respectively. Synchronized L1 worms bearing myo-3::GFP(mit) were imaged post hatching, and after 6 and 9 days of starvation. The percentage of worms showing complete fragmentation is quantified in C. N = 3 (total 30 worms per condition), error bars represent mean ± SD; **p = 0.0028 efk-1 line 1, **p = 0.0052 efk-1 line 2 at day 6, *p = 0.0334 efk-1 line 1, *p = 0.0334 efk-1 line 2 at day 9 vs. respective WT controls; ##p = 0.0015 WT day 9, ##p = 0.0052 efk-1 line 1 day 6, ###p = 0.0002 efk-1 line 1 day 9, ###p = 0.0008 efk-1 line 2 day 6, ####p < 0.0001 efk-1 line 2 day 9 vs. respective day 0 controls (two-way ANOVA with Dunnett’s multiple comparison’s test). Scale bar, 10 µm. D The graph shows continual oxygen consumption rate (normalized OCR per worm, y-axis) of WT and efk-1 mutants with or without the rescue construct efk-1::GFP in L1 starvation (hours of starvation, x-axis). N = 3-4, shaded area represents mean ± standard error of the mean (SEM); *p = 0.0219, ****p < 0.0001 vs. WT, ####p < 0.0001 vs. efk-1 (one-way ANOVA with Tukey’s multiple comparisons test). E Model of how efk-1 promotes starvation survival via a noncanonical pathway. Created in BioRender. Yan, J. (2025) https://BioRender.com/d17w564. WT, wild type; ns, not significant; ROS, reactive oxygen species; NAC, N-acetylcysteine; AUC, area under the curve; MitoQ, mitoquinone; OCR, oxygen consumption rate. Source data are provided in the Source Data file and Supplementary Data 4.

References

    1. El-Naggar, A. M. & Sorensen, P. H. Translational control of aberrant stress responses as a hallmark of cancer. J. Pathol.244, 650–666 (2018). - PubMed
    1. Wang, X., Xie, J. & Proud, C. G. Eukaryotic Elongation Factor 2 Kinase (eEF2K) in Cancer. Cancers9, 29186827 (2017). - PMC - PubMed
    1. Dever, T. E. & Green, R. The elongation, termination, and recycling phases of translation in eukaryotes. Cold Spring Harb. Perspect. Biol.4, a013706 (2012). - PMC - PubMed
    1. Delaidelli, A. et al. TB-16 exploration of eEF2K as a novel therapeutic target in medulloblastoma and neuroblastoma. Neuro-Oncol18, iii171–iii171 (2016).
    1. Leprivier, G. et al. The eEF2 kinase confers resistance to nutrient deprivation by blocking translation elongation. Cell153, 1064–1079 (2013). - PMC - PubMed

MeSH terms

Substances

LinkOut - more resources