. 2025 Feb 18;16(1):1750.
doi: 10.1038/s41467-025-56569-4.

iPSCs and iPSC-derived cells as a model of human genetic and epigenetic variation

Affiliations

iPSCs and iPSC-derived cells as a model of human genetic and epigenetic variation

Kara Quaid et al. Nat Commun. .

Abstract

Understanding the interaction between genetic and epigenetic variation remains a challenge due to confounding environmental factors. We propose that human induced Pluripotent Stem Cells (iPSCs) are an excellent model to study the relationship between genetic and epigenetic variation while controlling for environmental factors. In this study, we have created a comprehensive resource of high-quality genomic, epigenomic, and transcriptomic data from iPSC lines and three iPSC-derived cell types (neural stem cell (NSC), motor neuron, monocyte) from three healthy donors. We find that epigenetic variation is most strongly associated with genetic variation at the iPSC stage, and that relationship weakens as epigenetic variation increases in differentiated cells. Additionally, cell type is a stronger source of epigenetic variation than genetic variation. Further, we elucidate a utility of studying epigenetic variation in iPSCs and their derivatives for identifying important loci for GWAS studies and the cell types in which they may be acting.


Conflict of interest statement

Competing interests: The authors declare no competing interests.

Figures

Fig. 1
Fig. 1. Epigenetic variation increases as cells are differentiated, direct relationship to genetic variation becomes weaker.
A Study Design Graphic. Renal epithelial cells collected from the fresh urine samples of two related donors (F1 and M1) and one unrelated donor (F2) were reprogrammed into iPSCs.: lines F1_1, F1_2, F1_3, M1_1, M1_2, and F2_1. Each line has a technical replicate that was grown simultaneously. Each iPSC line, as well as NSCs, motor neurons, and monocytes differentiated from respective iPSC lines, were assayed for WGBS, ATAC-seq, and RNA-seq to measure DNA methylation, chromatin accessibility, and gene expression. B PCA plots of CpG methylation. Each point is a line colored by cell type, and each technical replicate has the same shape. Observations are the methylation levels (percentages) of CpGs with variance > 0.05 among samples. C PCA plots of ATAC reads within peaks. Each point is a line colored by cell type, and each technical replicate has the same shape. PCAs of reads within ATAC peaks for each of the differentiated cell lines. Each observation is the number of reads under a peak, normalized by library size in DiffBind. D PCA plots of exonic RNA-seq reads. Each point is a line colored by cell type, and each technical replicate has the same shape. Each observation is the number of exonic reads within a gene, normalized by sequencing depth and RNA composition in DESeq2. E Bar plots of the number of differentially methylated CpGs between each pair of lines in each of the differentiated cell lines. Bars are colored by the relationship between the donors of lines (same donor (orange), related donors (green), unrelated donors (purple)). F Bar plots of the number of differentially expressed genes between each pair of lines in each of the differentiated cell lines. Bars are colored by the relationship between the donors of lines. Color coding is the same as in (E). G Bar plots of the number of differentially accessible ATAC peaks between each pair of lines in each of the differentiated cell lines. Color coding is the same as in (E). Source data are provided as a Source Data file.
Fig. 2
Fig. 2. Epigenetic variation is more strongly related to genetic variation in iPSCs than differentiated cells.
A Barplot of the number of genetic variations, as compared to hg38, that are different between each donor. B Distribution of the size of structural variations as compared to hg38 that are different between donors. Ns for each comparison are listed above the corresponding boxes. Box plots are distributed such that the center line represents the median, the outer edges of the box represent the top and bottom 25%, and the whiskers the minimum and maximum. Outliers are represented as dots outside of the plot. C Aggregated odds ratios of all comparisons from each cell type for odds of differential accessibility given genetic variation. D Aggregated odds ratios of all comparisons from each cell type for odds of differential methylation given genetic variation. Source data are provided as a Source Data file.
Fig. 3
Fig. 3. Genetic variation and epigenetic variation interactions result in changes in gene expression.
A Box plot of log2 Fold Change gene expression difference between the two samples listed as a comparison, under the conditions that the gene overlapped a differentially accessible peak(DAP), a differentially methylated region (DMR), both, or neither. Ns for each comparison are listed above the corresponding boxes. Each group was compared to "No DAP or DMR" as a control group (See Supplementary Table 5). Box plots are distributed such that the center line represents the median, the outer edges of the box represent the top and bottom 25%, and the whiskers the minimum and maximum. Outliers are represented as dots outside of the plot. B Box plot of log2 Fold Change gene expression difference between the two samples listed as a comparison, under the condition that an associated HipSci eQTL overlapped a differentially accessible peak(DAP) or non differentially accessible peak (non-DAP). The distribution of change in gene expression for each comparison was tested against its corresponding nonDAP comparison as a control (See Supplementary Table 5). Ns for each comparison are listed above the corresponding boxes. Box plots are distributed such that the center line represents the median, the outer edges of the box represent the top and bottom 25%, and the whiskers the minimum and maximum. Outliers are represented as dots outside of the plot. C WashU Epigenome Browser 47 shot of the gene ZSCAN1. Methylation level is described by blue bars in the WGBS section, normalized read counts are described in the frequency plots for ATAC-seq and RNA-seq. Source data are provided as a Source Data file.
Fig. 4
Fig. 4. Epigenetic variation that is directly associated with genetic variation is not more likely to be shared across cell types.
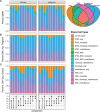
A Stacked bar chart of the percent of differentially methylated regions (DMRs) shared across cell types, divided into groups of peaks that overlapped genetic variation and groups of peaks that did not overlap a genetic variation between samples. The key indicates which cell type overlaps the bar chart responds to. For example, all_cell_types indicates the number of DMRs present in all cell types, and iPSC_NSC indicates that the DMRs are present in both iPSCs and NSCs. B Stacked bar chart of percent of differentially expressed genes shared across cell types, divided into groups of genes that overlapped a genetic variation and groups of genes that did not overlap a genetic variation between samples. C Stacked bar chart of percent of differentially accessible peaks shared across cell types, divided into groups of peaks that overlapped genetic variation and groups of peaks that did not overlap a genetic variation between samples. Source data are provided as a Source Data file.
Fig. 5
Fig. 5. Cell-type-specific enrichment of GWAS traits varies depending on presence or absence of underlying genetic variation.
A (Upper) Bar chart depicting linkage disequilibrium score regression (LDSC) coefficients of ATAC peaks in any F2 sample compared to randomized genomic regions of equivalent size. A positive coefficient indicates an enrichment of GWAS loci in ATAC peaks. (lower) Bar chart depicting unadjusted − log10 p-values of LDSC regression coefficients for each GWAS trait. P-values are determined for regression coefficients through two-sided T tests. B (Upper) Bar chart depicting LDSC coefficients for regression comparing ATAC peaks that were differentially accessible between any line for F2 to ATAC peaks that were not differentially accessible. (Lower) Bar chart depicting unadjusted − log10 p-values of LDSC regression coefficients for each GWAS trait. P-values are determined for regression coefficients through two-sided T tests. C (Upper) Bar chart depicting LDSC coefficients of ATAC peaks that did not overlap a genetic variation compared to ATAC peaks that did overlap a genetic variation. A positive coefficient indicates an enrichment of GWAS loci in peaks without genetic variation (lower) Bar chart depicting unadjusted − log10 p-values of LDSC regression coefficients for each GWAS trait. P-values are determined for regression coefficients through two-sided T tests. D WashU Epigenome Browser Shot47 of SNP rs4453556 in motor neurons. The SNP location is identified with the first red arrow and vertical black line. Matplot wrap is a lineplot showing expression (RNA-seq) of each of the samples, color-coded by a donor. Read counts from RNA-seq are displayed for each sample, as well as ATAC-seq. Source data are provided as a Source Data file.

References

    1. Macosko, E. Z. et al. Highly parallel genome-wide expression profiling of individual cells using nanoliter droplets. Cell161, 1202–1214 (2015). - PMC - PubMed
    1. Zhang, Q. et al. Genome-wide open chromatin regions and their effects on the regulation of silk protein genes in Bombyx mori. Sci. Rep.7, 12919 (2017). - PMC - PubMed
    1. Gibney, E. R. & Nolan, C. M. Epigenetics and gene expression. Heredity105, 4–13 (2010). - PubMed
    1. Natarajan, A., Yardimci, G. G., Sheffield, N. C., Crawford, G. E. & Ohler, U. Predicting cell-type-specific gene expression from regions of open chromatin. Genome Res.22, 1711–1722 (2012). - PMC - PubMed
    1. Wagner, J. R. et al. The relationship between DNA methylation, genetic and expression inter-individual variation in untransformed human fibroblasts. Genome Biol.15, R37 (2014). - PMC - PubMed

LinkOut - more resources