. 2025 Feb 18;16(1):1739.
doi: 10.1038/s41467-024-55513-2.

Statistical framework for calling allelic imbalance in high-throughput sequencing data

Affiliations

Statistical framework for calling allelic imbalance in high-throughput sequencing data

Andrey Buyan et al. Nat Commun. .

Abstract

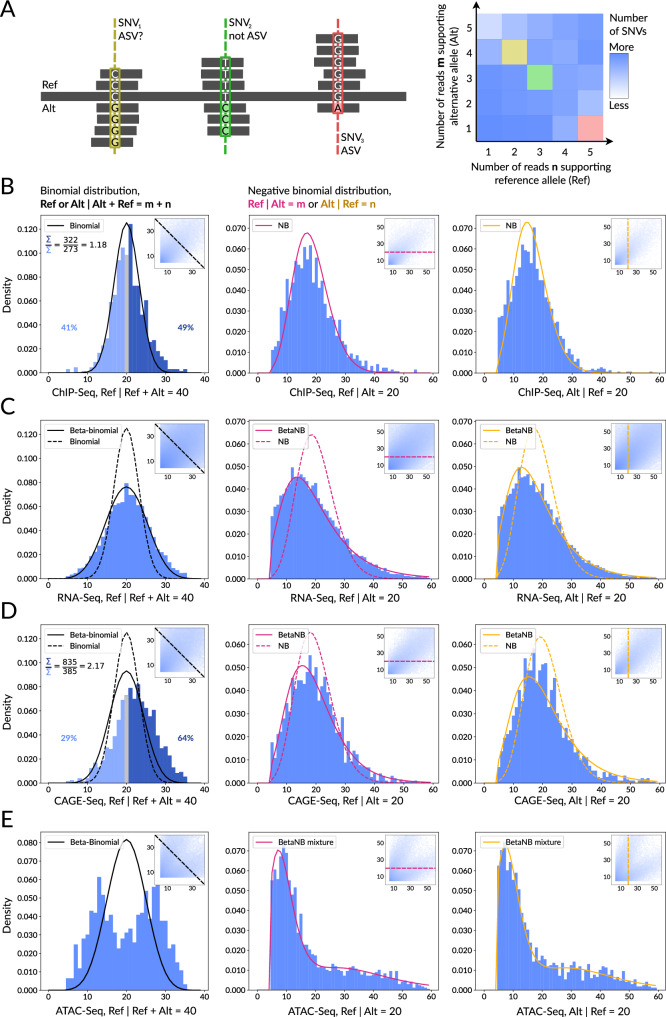
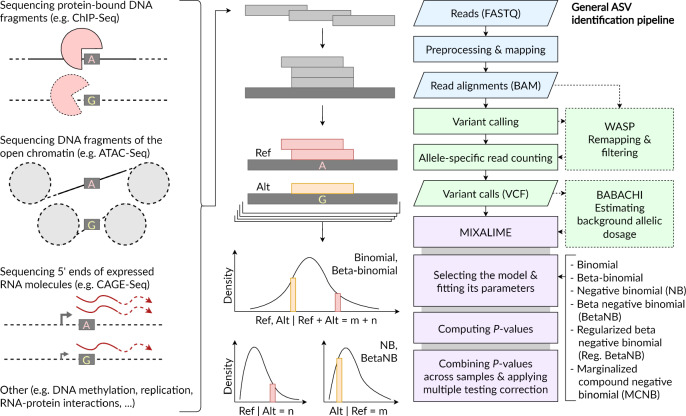
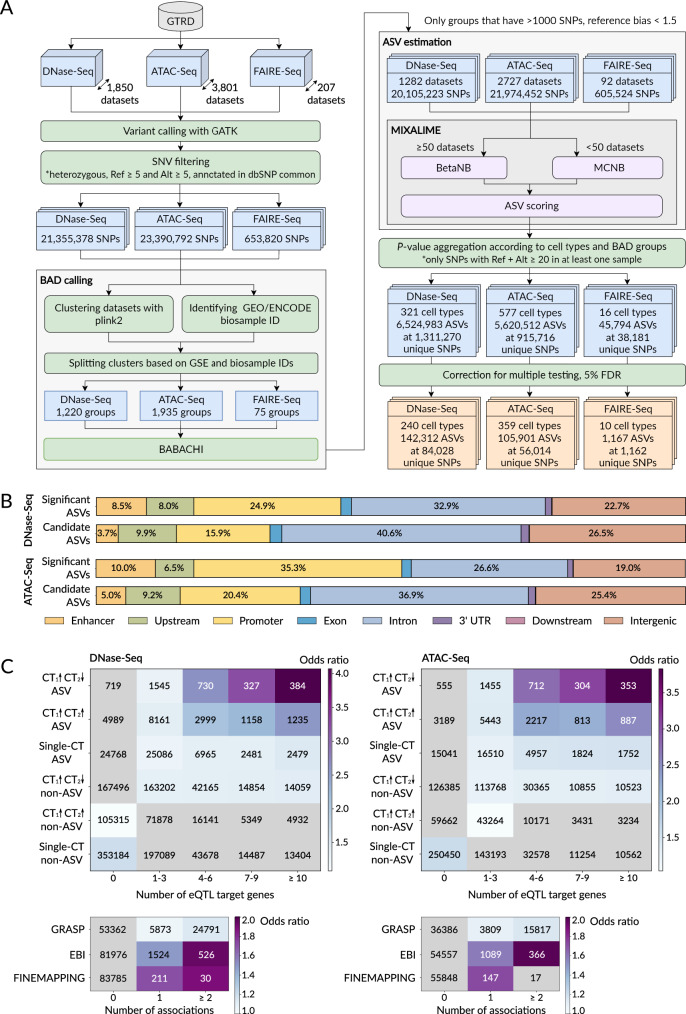
High-throughput sequencing facilitates large-scale studies of gene regulation and allows tracing the associations of individual genomic variants with changes in gene regulation and expression. Compared to classic association studies, the assessment of an allelic imbalance at heterozygous variants captures functional variant effects with smaller sample sizes, higher sensitivity, and better resolution. Yet, identification of allele-specific variants from allelic read counts remains challenging due to data-dependent biases and overdispersion arising from technical and biological variability. We present MIXALIME, a novel computational framework for calling allele-specific variants in diverse omics data with a repertoire of statistical models accounting for read mapping bias and copy number variation. We benchmark MIXALIME with DNase-Seq, ATAC-Seq, and CAGE-Seq data, and we demonstrate that the allelic imbalance highlights causal variants in GWAS results. Finally, as a showcase of the large-scale practical application of MIXALIME, we present an atlas of variants exhibiting allele-specific chromatin accessibility, built from thousands of available datasets obtained from diverse cell types.


Conflict of interest statement

Competing interests: The authors declare no competing interests.

Figures

Fig. 1
Fig. 1. Challenges of ASV calling from various omics data resolved by different statistical models.
A SNVs allelic coverage (left) and the distribution of allelic read counts visualized as a heatmap (right). B Reference mapping bias in 85 ChIP-Seq datasets from ADASTRA WA01 cells. The reference read count distribution (left) across the diagonal heatmap slice is fitted by the binomial model. The ratio of number of SNVs with Ref counts >20 (dark blue) to those with Ref counts <20 (light blue) is shown in the top-left of the plot, percentages of both groups of SNVs are shown on the sides of the histogram. The reference and alternative read count distributions across the horizontal and vertical heatmap slices (center, right) are fitted by the negative binomial model. C Allelic read counts overdispersion in 152 RNA-Seq datasets obtained from human left ventricles samples described in Sigurdsson et al.. The reference read counts distribution (left) across the diagonal heatmap slice is fitted by the binomial (dash line) and beta-binomial (solid line) models. The reference and alternative read count distributions (center, right) across the horizontal and vertical heatmap slices are fitted by the negative binomial (dash line) and beta negative binomial (solid line) models. D Extreme reference mapping bias and overdispersion in 109 heart CAGE-Seq datasets from Deviatiiarov et al., the order of subpanels as in (B, C). E Allelic read counts from CNV with BAD of 2 in ATAC-Seq datasets from UDACHA. The reference read count distribution (left) across the diagonal heatmap slice is fitted by the beta-binomial model. The reference and alternative read count distributions (center, right) across the horizontal and vertical heatmap slices are fitted by the mixture of beta-negative binomial models. Abbreviations: ASV Allele-Specific Variant, SNV Single Nucleotide Variant, CNV Copy-Number Variation, BAD Background Allelic Dosage.
Fig. 2
Fig. 2. ASV calling with MIXALIME.
Left: different types of omics experiments are suitable for calling ASVs. Middle: schematic illustration of ASV calling steps: read mapping, variant calling, imbalance scoring. Right: detailed ASV calling workflow. The read remapping and filtering with WASP, as well as background allelic dosage reconstruction with BABACHI, are optional steps denoted with dotted lines. Abbreviations: ASV Allele-Specific Variant.
Fig. 3
Fig. 3. Performance assessment of MIXALIME’s alternative scoring models.
Performance metrics for synthetic datasets with varying number of samples per SNV (A), varying BAD (B), varying reference bias for the mixture of biased and unbiased sub-datasets of different expected coverage (C). The first row shows the average AUPRC for different values of the synthetic dataset’s parameters. The panels in the second row show the precision-recall curve (the average for 20 datasets generated with different seeds) and AUPRC (center dot, mean; whiskers, standard deviation) for fixed parameter values (dashed line in the first row). D Bubble plots (left, middle) and heatmap (right) illustrating the overlap between CAGE ASVs (with and without WASP filtering) and heart eQTLs. Bubble size denotes the average number of significant ASVs overlapping eQTLs. The fill and the border colors denote the average statistical significance and the log2(odds ratio) relative to the results of the Binomial model (left, middle) or relative to the results obtained without WASP (right), respectively. In-panel black frames: particular comparisons discussed in the Results. P-value: one-sided Fisher’s exact test. E Bubble plots (left, middle) and heatmap (right) illustrating the overlap between ASVs and ASBs with and without accounting for the background allelic dosage, results are given relative to the Binomial model (left, middle) or relative to the no-BAD approach (right). Size, fill, and colors as in (D). F A radar plot demonstrating the number of significant ASVs (5% FDR), results of the one-sided Fisher’s exact test against eQTLs/ASBs (significance and odds ratios), and the respective fractions of ASVs for QuASAR and MIXALIME’s alternative models. G A radar plot demonstrating the median number of significant ASVs (5% FDR) across individuals, results of the one-sided Fisher’s exact test against eQTLs/ASBs (significance and odds ratios), and the respective fractions of ASVs for BaalChIP and MIXALIME’s alternative models. Abbreviations: AUPRC Area Under Precision-Recall Curve, ASB Allele-Specific Binding event, ASV Allele-Specific Variant, BAD Background Allelic Dosage, eQTL expression Quantitative Trait Locus, MCNB Marginalized Compound Negative Binomial, NB Negative Binomial, Reg. BetaNB regularized Beta Negative Binomial, FDR False Discovery Rate.
Fig. 4
Fig. 4. Assessing the relevance of heart CAGE common and differential ASVs.
A Difference between CAGE promoter activity, log2(CPM), for homozygous individuals carrying the alternative or the reference allele (center line, median; box limits, upper and lower quartiles; whiskers, 1.5x interquartile range; outliers not shown). X-axes: ASV FDR (left) or effect size bins (right), color: the preferred allele, P-values: one-sided Wilcoxon rank sum test. B CAGE ASV significance in different groups (center line, median; box limits, upper and lower quartiles; whiskers, 1.5x interquartile range; outliers not shown). X-axis: -log10(ASV FDR). Colored bars (top to bottom): All SNPs, ASBs, motif-concordant ASBs, heart ASBs from ADASTRA, and heart ASVs from UDACHA. Gray bars: coverage-matched random sets of SNPs of equal size, see Supplementary Fig. 2C. P-values: one-sided Wilcoxon rank sum test. C Intersection of the heart CAGE ASVs (5% FDR) with fine-mapped GTEx eQTLs. Left: log10(number of causative eQTLs). Right: odds ratios of the intersections. Colors: alternative fine-mapping approaches, the number of SNPs in the intersection is shown on top of each bar. D Left, Y-axis: the log2(Fold Change) between homozygous male and female samples, calculated as in (A). Left, X-axis: SNVs split by differential ASV FDR, ≥ or < 5%. Color: the ASV effect size, < or ≥ 0. One-sided Wilcoxon rank sum test P = 0.037 for 26 sex-specific ASVs and 0.81 for the remaining 1724 SNVs. Right: sex-specific expression of ZFX (center line, median; box limits, upper and lower quartiles; whiskers, 1.5x interquartile range). Y-axis: log2(CPM) estimated from gene-level counts, X-axis: sex. P-value: one-sided Wilcoxon rank sum test. E Left: the log2(Fold Change) difference between homozygous failing and healthy heart samples calculated and illustrated as in (D). One-sided Wilcoxon rank sum test P = 0.045 for 20 health state-specific ASVs and 0.27 for the remaining 1435 SNVs. Right: the health state-specific expression of CTCF, as in (D). X-axis: heart health state. P-value: one-sided Wilcoxon rank sum test. Abbreviations: CPM Counts-Per-Million, ES Effect Size, FC Fold Change, FDR False Discovery Rate, ASV Allele-Specific Variant, eQTL expression Quantitative Trait Locus, NB Negative Binomial, MCNB Marginalized Compound NB, Reg. BetaNB regularized Beta NB.
Fig. 5
Fig. 5. UDACHA, a uniform large-scale database of allele-specific chromatin accessibility in the human genome.
A UDACHA workflow from variant calling to ASV identification with MIXALIME. In the end, at 5% FDR, we identified 142312/105901/1167 ASVs in DNase-Seq/ATAC-Seq/FAIRE-Seq data, respectively. B Localization of chromatin ASVs in different types of genomic regions. The complete bars correspond to the full sets of SNPs coinciding with ASVs called from DNase-Seq (top) and ATAC-Seq (bottom). Bar labels: the percentage of ASVs falling into particular types of genomic regions. The top bar in each subpanel: significant ASVs passing 5% FDR, 84028 sites for DNase-Seq and 56014 for ATAC-Seq; bottom bar: candidate ASVs tested for significance, 1227242 sites for DNase-Seq and 859702 for ATAC-Seq. The annotation procedure is the same as in ADASTRA. C Top: eQTL enrichment of DNase-Seq (left) and ATAC-Seq (right) SNPs of different categories. Top panels, rows: different groups of ASVs: CT1 ↑ CT2 ↓ , ASVs with opposite allelic preferences in different cell types; CT1 ↑ CT2 ↑ , ASVs with the same allelic preferences across cell types; single-CT, ASVs significant in a single cell type only; non-ASVs, SNPs with ASV FDR  above  0.05. Columns: the number of eQTL target genes according to GTEx eQTL data. Bottom: the enrichment of DNase-Seq (left) and ATAC-Seq (right) ASVs with phenotype-associated SNPs. GWAS databases, rows: Genome-Wide Repository of Associations Between SNPs and Phenotypes (GRASP), European Bioinformatics Institute GWAS catalog (EBI), BROAD autoimmune diseases fine-mapping catalog (FINEMAPPING). Columns: the number of SNP associations with various phenotypes. The color scheme shows the odds ratios of the one-tailed Fisher’s exact test for a particular table cell against the rest. The gray cells correspond to non-significant enrichment with P > 0.05 after Bonferroni correction for the total number of tested cells. The values in the cells are the respective numbers of SNPs. Abbreviations: ASV Allele-Specific Variant, BAD Background Allelic Dosage, BetaNB Beta Negative Binomial, CT Cell Type, eQTL expression Quantitative Trait Locus, FDR False Discovery Rate, MCNB Marginalized Compound Negative Binomial, SNP Single Nucleotide Polymorphism, UTR UnTranslated Region.
Fig. 6
Fig. 6. Comparison of allele-specific variants with GWAS results.
A Heart CAGE ASVs intersection with the SNPs significantly associated with systolic blood pressure according to UK Biobank. Y-axis: one-sided Fisher’s exact test −log10(P-value) (left) and odds ratio (right). X-axis: different SNP groups based on their ASV significance: 2463 passing FDR 25%, 1781 for 10%, and 1455 for 5%. For ASVs passing FDR 5%, a set with the same number of coverage-matched SNPs but ASV FDR ≥ 0.5 was used for control. The color scale follows the Y-axis values. B S-LDSC regression results for 18 phenotypes from UK Biobank and 15 SNP categories from UDACHA (see Methods). Y-axis: GWAS trait used for partitioning heritability. X-axis: SNP categories for different cell lines and tissues used in the analysis including all SNPs, ASVs passing MIXALIME FDR 25, 10, and 5% as well as the control set of coverage-matched non-ASVs. The color scale denotes LDSC enrichment, and the asterisk for positive enrichment denotes the LDSC P < 0.1 adjusted for the number of traits. Abbreviations: ASV Allele-Specific Variant, FDR False Discovery Rate, SNP Single Nucleotide Polymorphism, S-LDSC Stratified Linkage Disequilibrium Score.

References

    1. Wainberg, M. et al. Opportunities and challenges for transcriptome-wide association studies. Nat. Genet.51, 592–599 (2019). - PMC - PubMed
    1. Uffelmann, E. et al. Genome-wide association studies. Nat. Rev. Methods Prim.1, 1–21 (2021).
    1. Li, B. & Ritchie, M. D. From GWAS to Gene: transcriptome-wide association studies and other methods to functionally understand GWAS Discoveries. Front. Genet.12, 713230 (2021). - PMC - PubMed
    1. Maurano, M. T. et al. Systematic localization of common disease-associated variation in regulatory DNA. Science337, 1190–1195 (2012). - PMC - PubMed
    1. Farh, K. K. et al. Genetic and epigenetic fine mapping of causal autoimmune disease variants. Nature518, 337–343 (2015). - PMC - PubMed

LinkOut - more resources