. 2025 Feb 18;16(1):1738.
doi: 10.1038/s41467-025-57044-w.

Macrophage SUCLA2 coupled glutaminolysis manipulates obesity through AMPK

Affiliations

Macrophage SUCLA2 coupled glutaminolysis manipulates obesity through AMPK

Chang Peng et al. Nat Commun. .

Abstract

Obesity is regarded as a chronic inflammatory disease involving adipose tissue macrophages (ATM), but whether immunometabolic reprogramming of ATM affects obesity remains unclarified. Here we show that in ATM glutaminolysis is the fundamental metabolic flux providing energy and substrate, bridging with AMP-activated protein kinase (AMPK) activity, succinate-induced interleukin-1β (IL-1β) production, and obesity. Abrogation of AMPKα in myeloid cells promotes proinflammatory ATM, impairs thermogenesis and energy expenditure, and aggravates obesity in mice fed with high-fat diet (HFD). Conversely, IL-1β neutralization or myeloid IL-1β abrogation prevents obesity caused by AMPKα deficiency. Mechanistically, ATP generated from glutaminolysis suppresses AMPK to decrease phosphorylation of the β subunit of succinyl-CoA synthetase (SUCLA2), thereby resulting in the activation of succinyl-CoA synthetase and the overproduction of succinate and IL-1β; by contrast, siRNA-mediated SUCLA2 knockdown reduces obesity induced by HFD in mice. Lastly, phosphorylated SUCLA2 in ATM correlates negatively with obesity in humans. Our results thus implicate a glutaminolysis/AMPK/SUCLA2/IL-1β axis of inflammation and obesity regulation in ATM.


Conflict of interest statement

Competing interests: The authors declare no competing interest.

Figures

Fig. 1
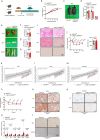
Fig. 1. Glutaminolysis in adipose tissue correlates with obesity and IL-1β.
af Metabolite detection and correlation analysis of white adipose tissue of human subjects. The ratio of α-ketoglutarate to glutamine (a), succinate to glutamine (c), fumarate to glutamine (e) in subcutaneous white adipose tissue, and correlation analysis between the ratio of α-ketoglutarate to glutamine (b), succinate to glutamine (d), fumarate to glutamine (f) in subcutaneous white adipose tissue and BMI value (n (BMI < 25) = 12 research objects, n (BMI > 25) = 10 research objects). g Reanalysis of the proteins correlated with glutamine in the obese cohort of the Jackson Heart Study from a published study, a total of 58 proteins (screen criteria: p value < 0.05 and p value adjusted for BMI > 0.05 in Table S4 of this study) were identified as potential contributors to obesity development. Gene Ontology analysis revealed significant enrichment in the inflammatory response and Interleukin-1 response among glutamine-correlated proteins. h Protein-protein Interaction analysis of the network of glutamine-related proteins in Fig. 1g through STRING, the red globules represent proteins associated with the inflammatory response. Data are presented as the mean ± SEM, and groups were compared by the unpaired two-tailed Student’s t test (a, c, e). linear regression analysis to assess the relationship between the variables, the significance of the regression models was evaluated using F-tests, these tests were conducted as two-sided tests to determine whether there were any significant differences or associations between the variables, a limited number of regression analyses was performed, and thus, no adjustments for multiple comparisons were deemed necessary (b, d, f). P < 0.05 was considered to be statistically significant.
Fig. 2
Fig. 2. AMPKα deficiency in myeloid cells aggravates HFD-induced obesity.
a Schematic diagram of mice feeding and this image was created in BioRender. Zang, Y. (2025) https://BioRender.com/e16k510b–r Male AMPKαfl/fl mice and LysM-Cre, AMPKαfl/fl mice with C57BL/6 background at the age of 6 weeks were fed HFD to explore the obesity and related phenotype. Body weight gain (b, n = 12 mice), representative mice image (c), relative fat and lean mass (d, n = 12 mice), the representative images of liver, BAT and ScWAT (e), the organ weight of liver (f, n = 12 mice), BAT (g, n = 12 mice) and ScWAT (h, n = 12 mice), representative H&E staining of the liver, BAT and ScWAT (i), insulin tolerance test (j, n = 11 mice in AMPKαfl/fl group and n = 12 mice in LysM-Cre, AMPKαfl/fl group), regression-based analysis of absolute metabolic rate against body mass of metabolic cage for light time (k, n = 6 mice), dark time (l, n = 6 mice) and a total day (m, n = 6 mice), the rectal temperature in cold exposure at 4 °C for different times (n, n = 9 mice), immunohistochemical staining of UCP-1 of BAT (o) and ScWAT (p) at room temperature (22 °C) and cold exposure (10 °C for 48 h), the proinflammatory genes of ScWAT (q, Ilb, Il6, Nos2 and Ccl2: n = 12 mice, Tnfa: n = 12 mice in AMPKαfl/fl group and n = 11 mice in LysM-Cre, AMPKαfl/fl group, F4/80: n = 10 mice) and immunohistochemical staining of F4/80 in BAT and ScWAT (r). Data are presented as the mean ± SEM, groups were compared by the unpaired two-tailed Student’s t test (d, f, g, h, j, n, q) or two-way ANOVA followed by Fisher’s LSD test (b). P < 0.05 was considered to be statistically significant.
Fig. 3
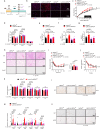
Fig. 3. IL-1β neutralizing antibody alleviates the aggravated obesity by AMPK deficiency in myeloid cells.
a Schematic diagram of mice feeding and this image was created in BioRender. Zang, Y. (2025) https://BioRender.com/e16k510. b–n Male AMPKαfl/fl mice and LysM-Cre, AMPKαfl/fl mice with C57BL/6 background at the age of 6 weeks were fed HFD with or without IL-1β neutralizing antibody (1 mg/kg, twice one week) to explore the obesity development. Immunofluorescent staining of IL-1β in BAT and ScWAT (b), body weight gain (c, n = 5 mice), relative fat and lean mass (d, n = 5 mice), the weight of Liver (e, n = 5 mice), BAT (f, n = 5 mice), and ScWAT (g, n = 5 mice), representative H&E staining of the liver, BAT and ScWAT (h), insulin tolerance test (i, n = 5 mice), the rectal temperature in cold exposure at 4 °C for different times (j, k, n = 5 mice), immunohistochemical staining of UCP-1 in BAT (l), the proinflammatory genes of ScWAT (m, Il1b, Tnfa, Nos2, Ccl2 and F4/80: n = 5 mice in each group, Il6: n = 4 mice in LysM-Cre, AMPKαfl/fl + IL-1β mAb group and n = 5 mice in other group), and the immunohistochemical staining of F4/80 in BAT and ScWAT (n). Data are presented as the mean ± SEM, groups were compared by two-way ANOVA followed by Fisher’s LSD test (cg, ik, m). P < 0.05 was considered to be statistically significant.
Fig. 4
Fig. 4. Myeloid IL-1β deficiency alleviates the aggravated obesity by myeloid AMPK deficiency.
a–t Male LysM-Cre, IL-1βfl/fl mice, LysM-Cre, IL-1βfl/fl, AMPKαfl/fl mice, AMPKαfl/fl mice, IL-1βfl/fl mice, and LysM-Cre, AMPKαfl/fl mice with C57BL/6 background at the age of 8 weeks were fed HFD to explore the obesity and related phenotype. Body weight change (a, n = 8 mice), body weight gain (b, n = 8 mice), representative mice image (c), relative fat and lean mass (d, n = 8 mice), the representative image of liver, BAT and ScWAT (e), the metabolic organ weight of liver (f, n = 8 mice), BAT (g, n = 8 mice) and ScWAT (h, n = 8 mice), representative H&E staining of liver, BAT and ScWAT (i), insulin tolerance test (j, n = 8 mice), the rectal temperature in cold exposure at 4 °C for different times (k, l, n = 8 mice), immunohistochemical staining of UCP-1 in BAT (m), the proinflammatory genes of ScWAT (ns, n = 8 mice) and immunohistochemical staining of F4/80 in BAT and ScWAT (t). Data are presented as the mean ± SEM, groups were compared by one-way ANOVA followed by Fisher’s LSD test (b, d, fh, right of j, l, ns) or two-way ANOVA followed by Fisher’s LSD test (a). P < 0.05 was considered to be statistically significant.
Fig. 5
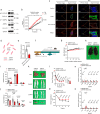
Fig. 5. Macrophage AMPK regulates IL-1β by phosphorylating SUCLA2.
a Schematic representation of the potential substrate of AMPK in succinate formation, and this image was created in BioRender. Zang, Y. (2025) https://BioRender.com/e16k510. Co-immunoprecipitation analysis of the interaction of AMPKα with SUCLA2 (b) or SUCLG2 (c) in RAW 264.7 cells. d Immunoblot analysis of indicated proteins in BMDMs that are transfected with siRNA for 30 h followed by stimulation with 100 ng/mL LPS for an additional 12 h. e Immunoblot analysis of indicated proteins in AMPKαfl/fl BMDMs (Flox) and LysM-Cre, AMPKαfl/fl BMDMs (MKO) that are transfected with siRNA for 18 h followed by stimulation with 100 ng/mL LPS for an additional 12 h. f Immunoblot analysis of the expression of SUCLG1 and SUCLA2 after AMPKα was knocked down by siRNA for 48 h in RAW 264.7 cells. g The relative enzymatic activity of SUCLA2 (the direction from succinyl-CoA to succinate) was detected after AMPKα was knocked down by siRNA for 36 h followed by stimulation with 100 ng/mL LPS for an additional 12 h in RAW264.7 cells (n = 3 biological replicates). h In vitro phosphorylation analysis was performed by mixing purified His-CAMKKβ, His-AMPKα1β1γ1 and His-SUCLA2 in the presence of ATP-g-S, and immunoblot analysis of indicated proteins with indicated antibodies. i Venn diagram was used to integrate the phosphorylation site that was detected by mass spectrometry and predicted by GPS 5.0 (http://gps.biocuckoo.cn/) or HPRD. j Protein sequence alignment indicated the conservation of SUCLA2 at Ser60 across multiple species. k Immunoblot analysis of indicated proteins in the in vitro kinase assay that mixed the purified His-CAMKKβ, His-AMPKα1β1γ1 with His-SUCLA2 (WT) or His-SUCLA2 (S60A). l Immunoblot analysis of indicated proteins in BMDMs after incubation with 200 µM A-769662 for 3 h. m In vitro phosphorylation analysis was performed by mixing purified His-CAMKKβ, His-AMPKα1β1γ1 and His-SUCLA2 (WT) or His-SUCLA2 (S60A) in the presence of ATP-g-S, and immunoblot analysis of indicated proteins with indicated antibodies. The enzymatic activity (the direction from succinyl-CoA to succinate) of purified WT-SUCLA2 (n) or S60A-SUCLA2 (o) after incubation with AMPK in vitro (n = 3 biological replicates). p The enzymatic activity (the direction from succinyl-CoA to succinate) of purified WT-SUCLA2, S60A-SUCLA2, and S60D-SUCLA2 in the same protein content (n = 4 biological replicates). q–r The relative gene expression of IL-1β in RAW264.7 cells that overexpress human WT-SUCLA2, S60A-SUCLA2 and S60D-SUCLA2 through lentivirus infection for 48 h followed the treatment by 100 ng/mL LPS for 6 h in the condition of glutamine replete (q) or deprived (r) condition (n = 4 biological replicates). The relative gene expression of IL-1β in RAW264.7 cells that overexpress human WT-SUCLA2 with S60A-SUCLA2 (s) or S60D-SUCLA2 (t) through lentivirus infection for 48 h, the cells were treated with 200 µM A-769662 for 3 h in advance followed by 100 ng/mL LPS for 6 h (n = 4 biological replicates). Data are presented as the mean ± SEM, groups were compared by the unpaired two-tailed Student’s t test (g) or one-way ANOVA followed by Bonferroni’s multiple-comparisons test (q, r) or two-way ANOVA followed by Bonferroni’s multiple-comparisons test (n, o, p, s, t), representative data are shown from one of the three independent experiments (bf, h, km). P < 0.05 was considered to be statistically significant.
Fig. 6
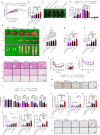
Fig. 6. Dowregulated macrophage SUCLA2 by siRNA delivering system combats HFD-induced obesity.
a Immunoblot analysis of indicated proteins in BMDMs after incubation with 100 ng/mL LPS for 3 h. b The enzymatic activity of SUCLA2 in BMDMs after incubation with 100 ng/mL LPS for 3 h (n = 3 biological replicates). c Immunofluorescent staining of F4/80 and pS60-SUCLA2 in the subcutaneous adipose tissue from lean or HFD-induced obese mice. d Schematic representation of the nanoparticle formation with p5RHH and siRNA, and this image was created in BioRender. Zang, Y. (2025) https://BioRender.com/e16k510. e The relative gene expression of SUCLA2 in BMDMs that were transfected with p5RHH-siRNA complex for 48 h (n = 4 biological replicates). f Schematic diagram of mice feeding and injection of p5RHH-siRNA complex, and this image was created in BioRender. Zang, Y. (2025) https://BioRender.com/e16k510. g–o Male C57BL/6 mice at the age of 8 weeks were fed HFD and received p5RHH-siCtrl or p5RHH-siSUCLA2 complex injection to explore the metabolic-related phenotype. Body weight gain (g, n = 10 mice), mice image (h), relative fat and lean mass (i, n = 10 mice), the organ weight of liver, EpWAT, ScWAT and BAT (j, n = 10 mice), the image of liver, EpWAT, ScWAT and BAT (k), insulin tolerance test (l, n = 10 mice in p5RHH+siCtrl group, and n = 9 mice in p5RHH+siSUCLA2 group), the rectal temperature in cold exposure at 4 °C for different times (m, n = 9 mice), and the proinflammatory genes of ScWAT (n, Il1b, Il6, Ccl2 and F4/80: n = 10 mice, Tnfa: n = 8 mice, Nos2: n = 10 mice in p5RHH+siCtrl group, and n = 9 mice in p5RHH+siSUCLA2 group) and EpWAT (o, Il1b, Il6, Nos2, Ccl2 and F4/80: n = 9 mice in p5RHH+siCtrl group, and n = 10 mice in p5RHH+siSUCLA2 group, Tnfa:n = 9 mice in each group). Data are presented as the mean ± SEM, groups were compared by the unpaired two-tailed Student’s t test (e, i, j, l, m, n, o), two-way ANOVA followed by Bonferroni’s multiple-comparisons test (b) and two-way ANOVA followed by Fisher’s LSD test (g), representative data are shown from one of the three independent experiments (a, c). P < 0.05 was considered to be statistically significant.
Fig. 7
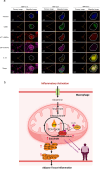
Fig. 7. Macrophage AMPK-SUCLA2-IL-1β pathway of adipose tissue is involved in human obesity.
a Immunofluorescent staining of CD68, pT172-AMPK, pS60-SUCLA2 and IL-1β in the subcutaneous adipose tissue from lean (BMI = 21.5), overweight (BMI = 25.7) or obese (BMI = 32.0) subjects, representative data are shown from one of the three independent experiments. b Model of how macrophage AMPK responds to glutaminolysis and regulates glutaminolysis-coupled IL-1β expression, and this image was created in BioRender. Zang, Y. (2025) https://BioRender.com/e16k510.

References

    1. Chooi, Y. C., Ding, C. & Magkos, F. The epidemiology of obesity. Metabolism92, 6–10 (2019). - PubMed
    1. Cefalu, W. T. et al. Advances in the science, treatment, and prevention of the disease of obesity: Reflections from a diabetes care editors’ expert forum. Diab. Care38, 1567–1582 (2015). - PMC - PubMed
    1. Chavakis, T., Alexaki, V. I. & Ferrante, A. W. Jr Macrophage function in adipose tissue homeostasis and metabolic inflammation. Nat. Immunol.24, 757–766 (2023). - PubMed
    1. Chawla, A., Nguyen, K. D. & Goh, Y. P. S. Macrophage-mediated inflammation in metabolic disease. Nat. Rev. Immunol.11, 738–749 (2011). - PMC - PubMed
    1. Sakamoto, T. et al. Macrophage infiltration into obese adipose tissues suppresses the induction of UCP1 level in mice. Am. J. Physiol.-Endocrinol. Metab.310, E676–E687 (2016). - PubMed

MeSH terms