. 2025 Feb 18;16(1):1719.
doi: 10.1038/s41467-025-57011-5.

GMRSP encoded by lncRNA H19 regulates metabolic reprogramming and alleviates aortic dissection

Affiliations

GMRSP encoded by lncRNA H19 regulates metabolic reprogramming and alleviates aortic dissection

Jizhong Wang et al. Nat Commun. .

Abstract

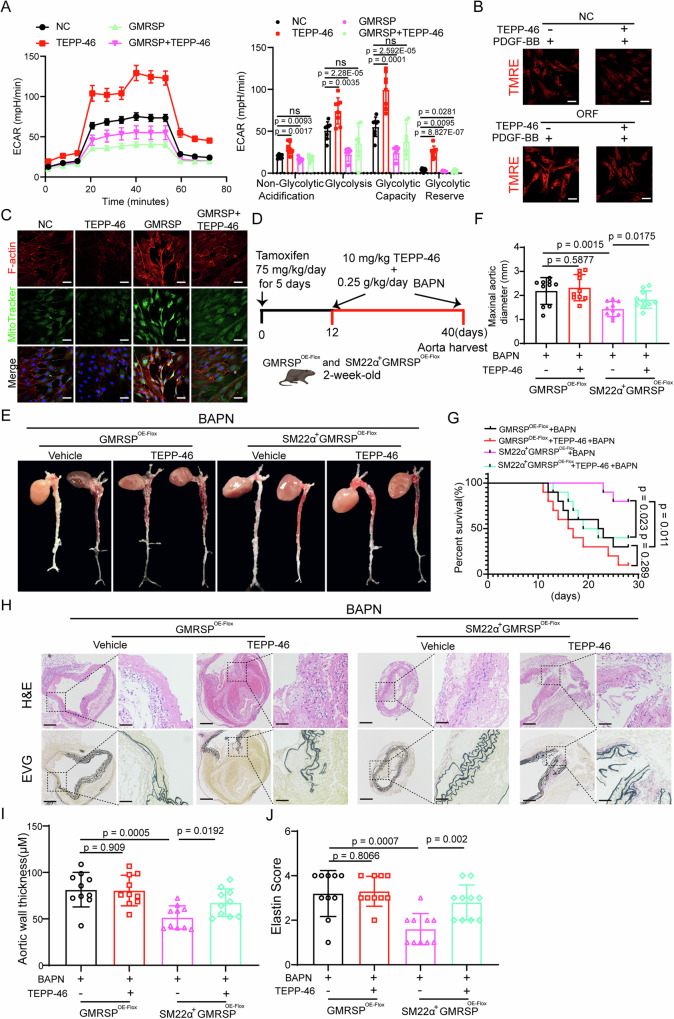
Metabolic disturbances are hallmarks of vascular smooth muscle cell (VSMC) phenotypic transitions, which play a critical role in the pathogenesis of aortic dissection (AD). In this study, we identify and characterize glucose metabolism regulatory protein (GMRSP), a protein encoded by lncRNA H19. Using VSMC-specific GMRSP induction in knock-in mice, adeno-associated virus-mediated GMRSP overexpression, and exosomal GMRSP delivery, we demonstrate significant improvements in AD and mitochondrial dysfunction. Mechanistically, GMRSP inhibits heterogeneous nuclear ribonucleoprotein (hnRNP) A2B1-mediated alternative splicing of pyruvate kinase M (PKM) pre-mRNA, leading to reduced PKM2 production and glycolysis. This reprogramming preserves the contractile phenotype of VSMCs and prevents their transition to a proliferative state. Importantly, pharmacological activation of PKM2 via TEPP-46 abrogates the protective effects of GMRSP in vivo and in vitro. Clinical relevance is shown by elevated plasma PKM2 levels in AD patients, which correlate with poor prognosis. Collectively, these findings indicate GMRSP as a key regulator of VSMC metabolism and phenotypic stability, highlighting its potential as a therapeutic target for AD.


Conflict of interest statement

Competing interests: The authors declare no competing interests.

Figures

Fig. 1
Fig. 1. Downregulation of GMRSP expression in human aortic dissection.
A Heatmap of the top 15 differentially expressed lncRNAs in normal human aortic tissues and AD tissues (q < 0.05, |Log2FC | >1). B Q-PCR analysis of H19 levels in the aorta of controls without AD (n = 7 biologically independent samples) and patients with AD (n = 9 biologically independent samples). C The 1253-nucleotide lncRNA H19 contains a potential small protein-encoding ORF, which may encode a 131-amino acid small protein, GMRSP. D Western blot analysis of the levels of GMRSP in the aorta of controls without AD (n = 7 biologically independent samples) and patients with AD (n = 9 biologically independent samples). E Representative images of GMRSP (red) co-localized with α-SMA (green)-positive vascular smooth muscle cells in aortic tissues from controls without AD (n = 5 biologically independent samples) and patients with AD (n = 5 biologically independent samples), Scale bar: 100 μm. After transfecting the indicated constructs into primary human VSMCs cells for 48 h, GFP fluorescence was detected by fluorescence microscope, Scale bar: 50 μm (F), and GMRSP-GFP fusion protein expression was detected by western blotting using anti-GFP and GMRSP antibodies (G). After transfecting the indicated constructs into primary human VSMCs for 48 h, GMRSP-Flag fusion protein levels were immunostained using anti-Flag, Scale bar: 20 μm (H) and GMRSP antibodies, Scale bar: 20 μm (I). J GMRSP-Flag was overexpressed in VSMCs, followed by detection with anti-Flag and GMRSP antibodies. Data are presented as the mean ± SD. The p values were calculated by a two-tailed unpaired Student’s t-test in (B, D). The data presented in (F–J) are representative of three independent experiments. Source data are provided as a Source Data file. AD, aortic dissection; RT-PCR; reverse transcriptase-polymerase chain reaction; VSMCs, vascular smooth muscle cells; GMRSP; glucose metabolism regulatory small protein; SMA, smooth muscle actin; GFP, green fluorescent protein; IP, immunoprecipitation.
Fig. 2
Fig. 2. GMRSP overexpression represses thoracic aortic dissection formation.
A Male mice were induced with tamoxifen for 5 days at two weeks. One week after the last tamoxifen treatment, GMRSPOE-flox and SM22α+GMRSPOE-flox mice were treated with 0.25% BAPN monofumarate for four weeks (n = 10 biological replicates per group). B Representative images of the aorta of the mice are shown. C The survival rate was estimated by the Kaplan-Meier method and compared using the Breslow test (n = 10 biological replicates per group). D The incidence of AD was statistically analyzed. E The maximum aortic diameter was measured (n = 10 biological replicates per group). F Representative macroscopic images of aorta sections stained with H&E and EVG, Scale bar: 200 μm and 50 μm. The wall thickness (G) and elastin integrity (H) of each groups were analyzed (n = 10 biological replicates per group). I Immunofluorescence staining of α-SMA (green) and GMRSP (red) in the aorta of the mice is shown. Nuclei were counterstained with DAPI. J Immunofluorescence staining of SM22α (green) and MMP2 (red) in the aorta of the mice is shown. Nuclei were counterstained with DAPI,Scale bar: 200 μm. Data are presented as the mean ± SD.The p values were calculated by a two-tailed unpaired Student’s t-test in (E,G,H). The p values were calculated by Kaplan–Meier analysis and two-sided Breslow Test (C).The data presented in (F,I, J) are representative of three independent experiments. Source data are provided as a Source Data file. GMRSP; glucose metabolism regulatory small protein; SMC; smooth muscle cell; AD, aortic dissection; BAPN, β-aminopropionitrile; H&E, hematoxylin and eosin; EVG, elastic–Van Gieson; SMA, smooth muscle actin; DAPI, 4’,6-diamidino-2-phenylindole; SM22α, smooth muscle protein 22-alpha; MMP2, matrix mettaloproteinase2.
Fig. 3
Fig. 3. GMRSP is required for maintaining oxidative metabolism via regulating the PKM pre-mRNA splicing in VSMCs.
A Dotplot showing metabolic characteristics of vascular smooth muscle cells from patients with/without aortic dissection using scMetabolism algorithm based on the GSE213740. The circle size and color darkness both represent the scaled metabolic score. B, C GO analysis (D) and KEGG (E) analysis between H19-positive and H19-negative vascular smooth muscle cells in GSE213740. D After transfection with the indicated constructs for 36 hours, followed by PDGF-BB (20 ng/mL) treatment for 24 h, RNA sequencing was performed in human primary VSMCs. GMRSP regulates PKM pre-mRNA splicing, promoting PKM1 isoform formation and inhibiting PKM2 isoform formation. E Representative immunofluorescent images of F-actin (red), PKM1 (yellow), and PKM2 (green) in human primary VSMCs were determined, Scale bar: 50 μm. The seahorse glycolysis stress test (n = 8 biologically independent samples) (F) and representative images of TMRE staining, Scale bar: 50 μm (G), F-actin and MitoTracker staining, Scale bar: 5 μm (H) were obtained in human primary VSMCs transfected with the indicated constructs for 36 h, followed by PDGF-BB (20 ng/mL) treatment for 24 hours. Data are presented as the mean ± SD. The p values were calculated by a two-tailed unpaired Student’s t-test in (F). The data presented in (EG) are representative of three independent experiments. Source data are provided as a Source Data file. GO, gene ontology; KEGG, Kyoto Encyclopedia of Genes and Genomes; PDGF, platelet-derived growth factor; VSMCs, vascular smooth muscle cells; GMRSP; glucose metabolism regulatory small protein; PKM, pyruvate kinase M; TMRE, tetra-methyl-rhodamine ester.
Fig. 4
Fig. 4. Activating PKM2 reverses the protective effect of GMRSP in both in vitro and in vivo.
Seahorse glycolysis stress test (n = 8 biologically independent samples) (A), representative images of TMRE staining, Scale bar: 50 μm (B), F-actin and MitoTracker staining, Scale bar: 50 μm (C) were performed in human primary VSMCs transfected with the indicated constructs for 36 h, followed by TEPP-46 (20 µmol/L) and PDGF-BB (20 ng/mL) treatment for 24 h. D SM22α+GMRSPOE-flox mice were induced with tamoxifen for 5 days at two weeks. One week after the last tamoxifen treatment, mice were treated with 0.25% BAPN monofumarate and TEPP-46 (10 mg/kg) for four weeks (n = 10 biological replicates per group). E Representative images of the mouse aorta are shown. F Maximum aortic diameter measurement (n = 10 biological replicates per group). G Survival rate estimation using the Kaplan-Meier method and comparison using the Breslow test (n = 10 biological replicates per group). H Representative macroscopic images of aorta sections were stained with H&E and EVG, Scale bar: 200 μm and 50 μm. The wall thickness (I) and elastin integrity (J) of each groups were analyzed(n = 10 biological replicates per group). Data are presented as the mean ± SD. The p values were calculated by a two-tailed unpaired Student’s t-test in (A, F, I, J). The p values were calculated by Kaplan–Meier analysis and two-sided Breslow test (G). The data presented in (A, B, C, H) are representative of three independent experiments. Source data are provided as a Source Data file. BAPN, β-aminopropionitrile.
Fig. 5
Fig. 5. The role of the expression level of PKM2 in plasma in the diagnosis and prognosis of AD.
A The PKM splicing assay was performed in the aorta of controls without AD (n = 7 biologically independent samples) and patients with AD (n = 9 biologically independent samples). B The levels of PKM1 and PKM2 mRNA were positively and negatively correlated with the levels of GMRSP mRNA in the aorta of controls without AD (n = 7 biologically independent samples) and patients with AD (n = 9 biologically independent samples), respectively. C Immunofluorescence staining of PKM1, GMRSP, PKM2 and SM22α in the aorta from controls without AD (n = 5 biologically independent samples) and patients with AD (n = 5 biologically independent samples) were shown. Nuclei were counterstained with DAPI, Scale bar: 100 μm. D Distribution of plasma levels of PKM2 in healthy controls (n = 60 biologically independent samples) and patients with type B AD (n = 89 biologically independent samples)or type A AD (n = 56 biologically independent samples). E Receiver operating characteristic curves: patients with AD vs. healthy controls for PKM2. F The discrepancy of the maximum aortic diameter in patients with high (>2.40 ng/mL,n = 68 biologically independent samples) or low levels of PKM2 ( ≤ 2.40 ng/mL,n = 77 biologically independent samples). G Cumulative Kaplan-Meier estimates of MACE during follow-up stratified by the levels of PKM2 (2.40 ng/mL). Data are presented as the mean ± SD. The p values was calculated using two-sided Spearman’s correlation test in B. The p values were calculated by a two-tailed unpaired Student’s t-test in (D, F). Area under the Receiver operating characteristic curve (AUC) and the 95% confidence interval (CI) were used to evaluate the predictive accuracy of PKM2(E). The p values were calculated by Kaplan–Meier analysis and two-sided Breslow Test (G). Source data are provided as a Source Data file. MACE, major adverse events.
Fig. 6
Fig. 6. GMRSP Interacts with the Gly-rich domains of hnRNP A2B1.
A Silver staining identifies the specific bands for GMRSP-co-IP. B The GMRSP-Flag plasmid was transfected into HEK293T cells, cellular lysates were treated with 10 mg/mL RNase A for one hour or left untreated, GMRSP-Flag complexes were co-IPed by anti-Flag antibody, and hnRNPA2B1 was determined. C The hnRNPA2B1-HA plasmid was transfected into HEK293T cells, cellular lysates were treated with 10 mg/mL RNase A for one hour or left untreated, hnRNPA2B1-HA complexes were co-IPed by anti-HA antibody, and GMRSP was determined. D Immunofluorescence of GMRSP (red) co-localized with hnRNPA2B1 (green) in VSMCs. Nuclei were stained with DAPI (blue), Scale bar: 20 μm. E An illustration of the truncated hnRNPA2B1 domains is shown. F, G The WT and the indicated mutants of hnRNPA2B1-HA, together with the GMRSP-Flag vector, were co-transfected into HEK293T cells. hnRNPA2B1-HA (F) and GMRSP-Flag (G) complexes were co-IPed with anti-HA and anti-Flag antibodies, respectively, to detect GMRSP-Flag and hnRNPA2B1-HA, respectively. H Molecular docking analysis of the GMRSP and hnRNPA2B1 Gly-rich domains. I, L The indicated hnRNPA2B1-HA mutant (hnRNPA2B13G/Y: G217A, G218A, G221A, and Y222A) together with the GMRSP-Flag vector were co-transfected into HEK293T cells. The indicated GMRSP-Flag mutants (GMRSPL/C/T: L12A, C16A, and T94A), together with the hnRNPA2B1-HA vector, were co-transfected into HEK293T cells. The interaction of the hnRNPA2B1 with GMRSP was determined using anti-Flag antibodies (I and J) and anti-HA antibodies (K and L). M MST detection of interactions between GMRSP and GMRSPL/C/T with hnRNPA2B1, respectively(i = 3 biologically independent samples). Data are presented as the mean ± SD. The data presented in (A-M) are representative of three independent experiments. Source data are provided as a Source Data file. Co-IP, co-immunoprecipitation; hnRNP, heterogeneous nuclear ribonucleoprotein; MST, microScale thermophoresis.
Fig. 7
Fig. 7. GMRSP Blocks the Increase of PKM2, the Decrease of PKM1, glycolysis, and mitochondrial dysfunction Induced by hnRNP A2B1 overexpression.
AF The GMRSP-Flag vector, together with the hnRNPA2B1-HA vector, was co-transfected into human primary VSMCs for 36 h, followed by PDGF-BB (20 ng/mL) treatment for 24 h (n = 5 per group). The indicated protein levels were detected (A). The PKM splicing assay was performed (B). Representative immunofluorescent images of F-actin (red), PKM1 (yellow), and PKM2 (green) were determined, Scale bar: 50 μm (C). The seahorse glycolysis stress test (n = 8 biologically independent samples) (D) representative images of TMRE staining, Scale bar: 50 μm (E), and MitoTracker staining, Scale bar: 50 μm (F) were performed. Data are presented as the mean ± SD. The p values were calculated by a two-tailed unpaired Student’s t-test in D. The data presented in (AF) are representative of three independent experiments. Source data are provided as a Source Data file.
Fig. 8
Fig. 8. GMRSP-EVs improve AD formation in vivo.
A Representative images of EVs were visualized using TEM. Scale bars: left, 50 nm; right, 100 nm. B The particle size of EVs was measured by NTA. C Representative images of the internalization of mCherry (red)-labeled EVs were visualized, Scale bar: 50 μm. D A schematic diagram of the experimental therapy: mice were intravenously injected with 500 ug/kg/day EVs for 7 days. Meanwhile, EV-treated mice were also treated with 0.25% BAPN monofumarate for four weeks (n = 15 biological replicates per group). E Representative images of the aorta of the mice are shown. F The survival rate was estimated using the Kaplan-Meier method(n = 15 biological replicates per group). G, H AD incidence and maximum aortic diameter were detected (n = 15 biological replicates per group). I Representative macroscopic images of aorta sections were performed with H&E staining and EVG staining, Scale bar: 200 μm and 50 μm. J Schematic representation of signaling events mediated by GMRSP signaling during the pathogenesis of AD.Data are presented as the mean ± SD. The p values were calculated by a two-tailed unpaired Student’s t-test in H. The p values were calculated by Kaplan–Meier analysis and two-sided Breslow test (F). The data presented in (A, B, C, I) are representative of three independent experiments.Source data are provided as a Source Data file. EV, extracellular vesicles; TEM, transmission electron microscope; NTA, nanoparticle tracking analysis.

References

    1. Evangelista, A. et al. Insights From the International Registry of Acute Aortic Dissection: A 20-Year Experience of Collaborative Clinical Research. Circulation137, 1846–1860 (2018). - PubMed
    1. Chakraborty, A. et al. Epigenetic Induction of Smooth Muscle Cell Phenotypic Alterations in Aortic Aneurysms and Dissections. Circulation148, 959–977 (2023). - PMC - PubMed
    1. Gao, J. et al. The mechanism and therapy of aortic aneurysms. Signal Transduct. Target Ther.8, 55 (2023). - PMC - PubMed
    1. Ali, L., Schnitzler, J. G. & Kroon, J. Metabolism: The road to inflammation and atherosclerosis. Curr. Opin. Lipido.29, 474–480 (2018). - PubMed
    1. Caruso, P. et al. Identification of MicroRNA-124 as a Major Regulator of Enhanced Endothelial Cell Glycolysis in Pulmonary Arterial Hypertension via PTBP1 (Polypyrimidine Tract Binding Protein) and Pyruvate Kinase M2. Circulation136, 2451–2467 (2017). - PMC - PubMed

MeSH terms

LinkOut - more resources