. 2025 Feb 18;11(1):64.
doi: 10.1038/s41420-025-02331-0.

Decreased miR-128-3p in serum exosomes from polycystic ovary syndrome induces ferroptosis in granulosa cells via the p38/JNK/SLC7A11 axis through targeting CSF1

Affiliations

Decreased miR-128-3p in serum exosomes from polycystic ovary syndrome induces ferroptosis in granulosa cells via the p38/JNK/SLC7A11 axis through targeting CSF1

Yanqiu Lv et al. Cell Death Discov. .

Abstract

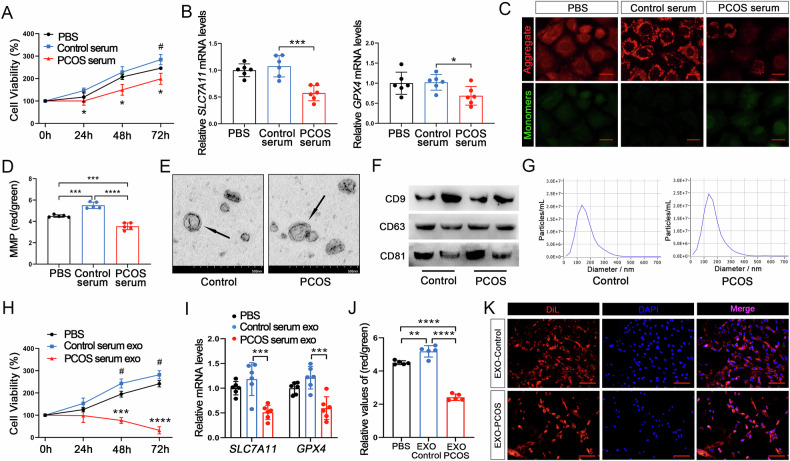
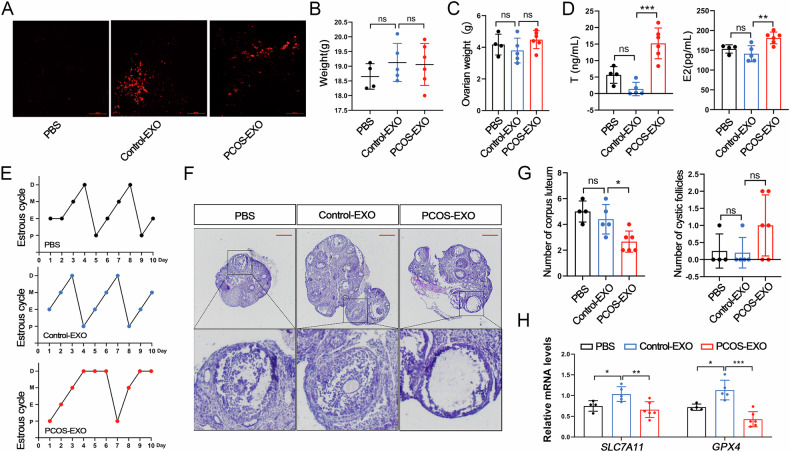
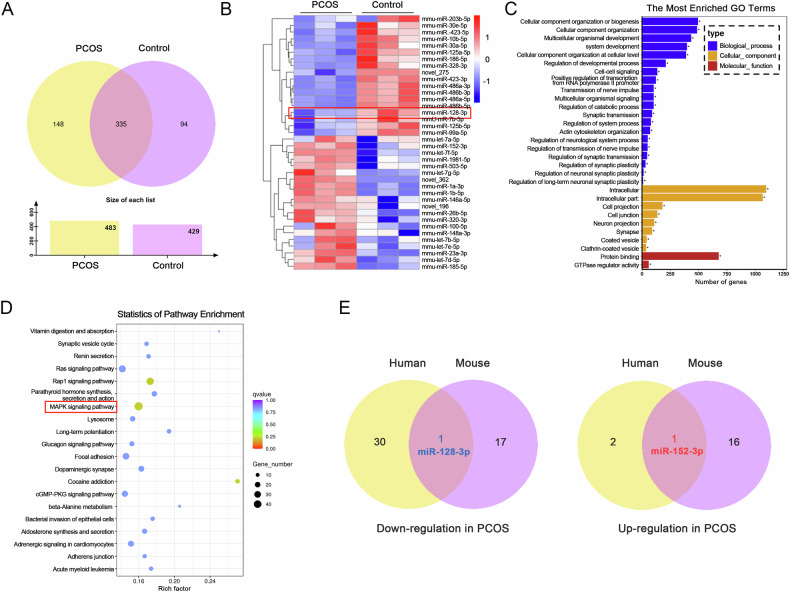
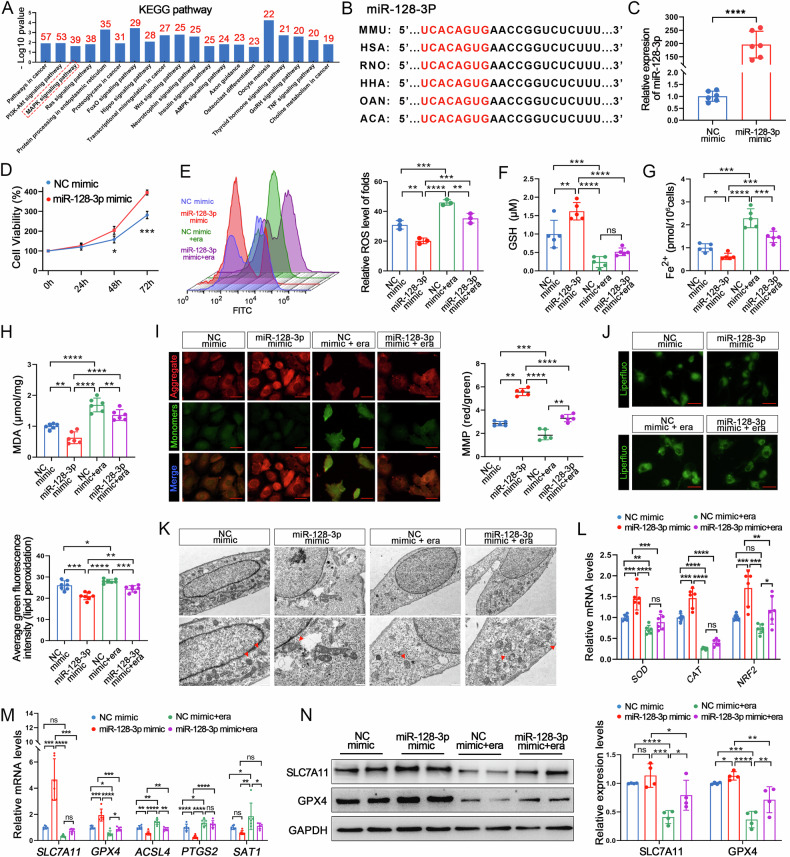
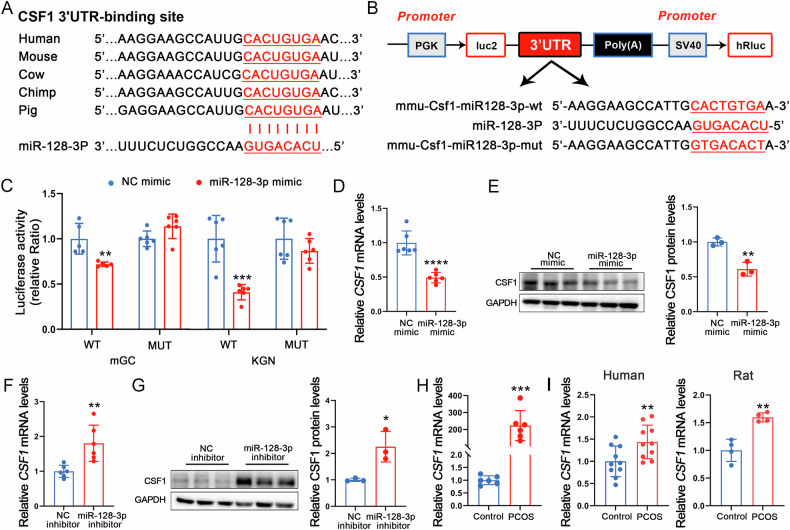
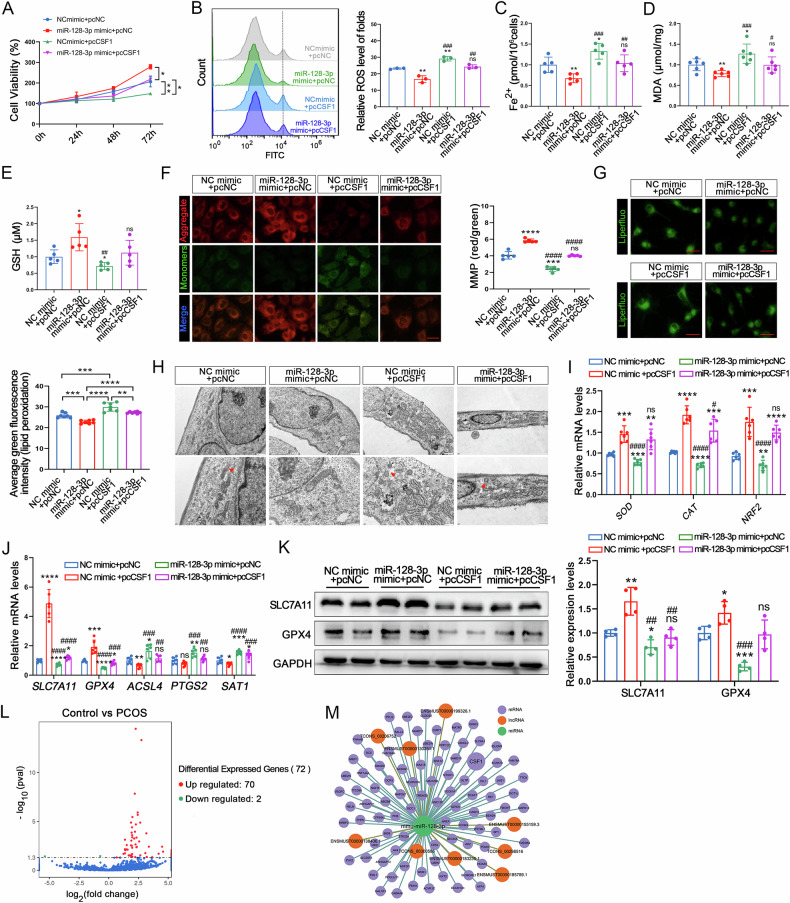
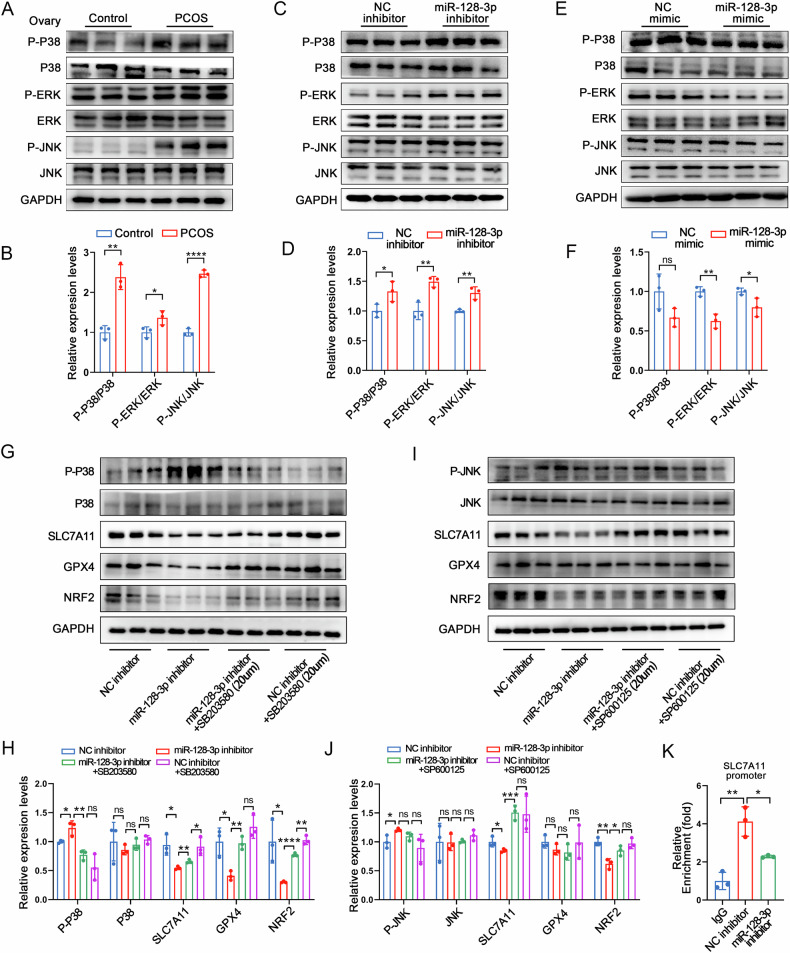
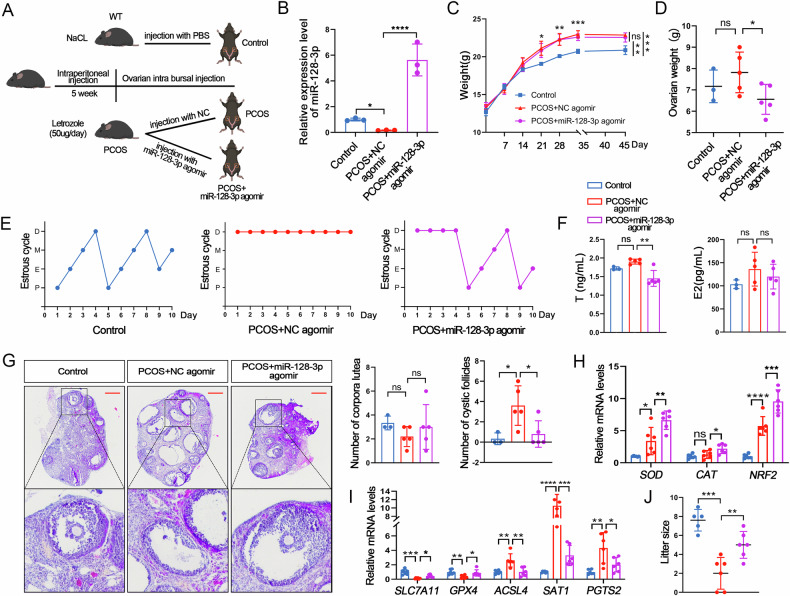
Increasing evidence suggests that non-coding small RNAs (miRNAs) carried by exosomes (EXOs) play important roles in the development and treatment of polycystic ovary syndrome (PCOS). In this study, we demonstrate that PCOS mouse serum-derived EXOs promote granulosa cells (GCs) ferroptosis, and induce the occurrence of a PCOS-like phenotype in vivo. Notably, EXO miRNA sequencing combined with in vitro gain- and loss-of-function assays revealed that miR-128-3p, which is absent in the serum-derived EXOs of mice with PCOS, regulates lipid peroxidation and GC sensitivity to ferroptosis inducers. Mechanistically, overexpression of CSF1, a direct target of miR-128-3p, reversed the anti-ferroptotic effect of miR-128-3p. Conversely, ferroptosis induction was mitigated in CSF1-downregulated GCs. Furthermore, we demonstrated that miR-128-3p inhibition activates the p38/JNK pathway via CSF1, leading to NRF2-mediated down-regulation of SLC7A11 transcription, which triggers GC iron overload. Moreover, intrathecal miR-128-3p AgomiR injection into mouse ovaries ameliorated PCOS-like characteristics and restored fertility in letrozole-induced mice. The study reveals the pathological mechanisms of PCOS based on circulating EXOs and provides the first evidence of the roles of miR-128-3p and CSF1 in ovarian GCs. This discovery is expected to provide promising therapeutic targets for the treatment of PCOS.


Conflict of interest statement

Competing interests: The authors declare no competing interests. Ethics approval and consent to participate: This study was performed following the approval of the Experimental Animal Ethics Committee of Yanbian University (approval number syxk2020-0009). All the experiments were implemented on the guide for the care and use of laboratory animals. Consent for publication: We have obtained consent to publish this paper from all of the study participants.

Figures

Fig. 1
Fig. 1. PCOS mouse serum and serum-derived exosomes (EXOs) promote granulosa cell (GCs) ferroptosis.
A Cell viability of GCs incubated with control and PCOS mouse serum for 0, 24, 48, or 72 h. *P < 0.05 vs Control serum, # P < 0.05 vs Control serum. B mRNA expression levels of ferroptosis-related genes in GCs as determined using qRT-PCR. C, D Determination of mitochondrial membrane potential (MMP) levels in GCs. Scale bar: 30 μm. E Transmission electron microscopic (TEM) analysis of serum-derived EXOs. Scale bar: 500 nm. F Western blot analysis of the EXO-specific marker proteins, CD9, CD63, and CD81. G EXO particle size as determined through the ZetaView analysis. H Cell viability of GCs incubated with serum EXOs for 0, 24, 48, or 72 h. ***P < 0.001 vs Control serum exo, ****P < 0.0001 vs Control serum exo, # P < 0.05 vs Control serum exo. I Relative mRNA levels of SLC7A11 and GPX4 in serum EXO-treated GCs. J MMP levels in GCs treated with EXOs as determined using JC-1 staining. K Co-culture assay showing that labelled serum EXOs can enter GCs. Scale bar: 200 μm. Data are presented as Mean ± SD. *P < 0.05, **P < 0.01, ***P < 0.001, ****P < 0.0001.
Fig. 2
Fig. 2. PCOS mouse serum-derived EXOs induce oestrous disorders and increase ferroptosis in mice.
A Immunofluorescence imaging of ovarian tissues 24 h after serum-derived EXO injection, Scale bar: 100 μm. B, C Measurement of body and ovarian weights in mice in each group. D Steroid sex hormone concentrations in the sera of mice from the different groups as determined via ELISA. E Evaluation of representative oestrous cycles after injection of serum EXOs, “P:” proestrous, “E:” oestrous, “M:” metoestrous, “D:” dioestrus. F, G Corpus luteum and cystic follicle counts following H&E staining. Scale bar: 300 μm. H Ferroptosis-related gene mRNA expression levels. Data are presented as Mean ± SD. Ns P > 0.05, *P < 0.05, **P < 0.01, ***P < 0.001, ****P < 0.0001.
Fig. 3
Fig. 3. miRNA expression profiles of serum-derived EXOs from PCOS and control mice.
A Venn diagram showing common and specific miRNA expression in control and PCOS mouse serum-derived EXOs. B Hierarchical clustering analysis showing 18 downregulated and 17 upregulated miRNAs, as well as significantly decreased miR-128-3p expression, in PCOS mouse serum-derived EXOs. C GO and (D) KEGG enrichment analyses of differentially expressed miRNAs. E miRNAs that are co-downregulated and co-upregulated in humans and mice in the database. Serum samples from 250 mice in each group were pooled for EXO isolation. The extracted EXO were subjected to miRNA-seq with three technical replicates performed per group to ensure reliability. Data are presented as Mean ± SD. *P < 0.05, **P < 0.01, ***P < 0.001.
Fig. 4
Fig. 4. Overexpression of miR-128-3p inhibits GC ferroptosis.
A Analysis of signalling pathways involving miR-128-3p using Diana Tools, the red numbers indicate the number of target genes enriched in this pathway. B Sequence of mature miR-128-3p for different species. C miR-128-3p mimic treatment increased miR-128-3p levels in GCs. D GC cell viability as determined through the CCK-8 assay. E ROS, (F) GSH, (G) Fe2+ and (H) MDA levels in GCs treated with erastin and the miR-128-3p mimic. I Measurement of MMP levels in GCs treated with erastin and the miR-128-3p mimic. Scale bar: 30 μm. J Lipid Peroxidation Levels Assessed by Liperfluo Staining. Scale bar: 30 μm. K Low- and high-magnification images obtained by TEM, The red arrows indicate the outer mitochondrial membrane was ruptured and the mitochondrial cristae decreased or disappeared. Scale bar: 1 μm and 500 nm. L Relative mRNA levels for oxidative stress-related genes in GCs. M, N mRNA and protein levels for ferroptosis-related genes. Data are presented as Mean ± SD. Ns P > 0.05, *P < 0.05, **P < 0.01, ***P < 0.001, ****P < 0.0001.
Fig. 5
Fig. 5. CSF1 is a direct target gene for miR-128-3p.
A Alignment results for the 3′ untranslated region (3′ UTR) sequence of CSF1 from different species. B, C Dual luciferase reporter assay for miR-128-3p on the CSF1 3′ UTR in mGCs and KGN cells 48 h post transfection with miRNA and a luciferase reporter sequence containing mutant (MUT) CSF1 3′ UTR (pmiRGLO -3′ UTR of CSF1-MUT) or wild type (WT) CSF1 3′ UTR (pmiRGLO-3′ UTR of CSF1-WT). D, E The mRNA and protein levels of CSF1 in GCs were detected after transfection with miR-128-3p mimics. F, G The mRNA and protein levels of CSF1 in GCs were detected after transfection with miR-128-3p inhibitor. H The mRNA expression of CSF1 in ovary was detected by RT-qPCR. I The mRNA expression levels of CSF1 in human and rat databases. Data are presented as Mean ± SD. *P < 0.05, **P < 0.01, ***P < 0.001, ****P < 0.0001.
Fig. 6
Fig. 6. CSF1 mediates the effects of miR-128-3p on GC ferroptosis.
A The CCK-8 assay was performed to determine the cell viability of GC. B ROS levels were measured using flow cytometry. C Fe2+ content. D MDA levels. E GSH levels. F Determination of MMP levels in GCs through JC-1 staining. Scale bar: 30 μm. G Lipid Peroxidation Levels Assessed by Liperfluo Staining. Scale bar: 30 μm. H Low- and high-magnification images obtained by TEM, The red arrows indicate the outer mitochondrial membrane was ruptured and the mitochondrial cristae decreased or disappeared. Scale bar: 1 μm and 500 nm. I Relative SOD, CAT, and NRF2 mRNA levels. J, K Ferroptosis-related gene mRNA and protein levels in GCs as determined through RT-qPCR and western blotting. L Volcano plot analysis showing that there are 2 downregulated and 70 upregulated lncRNAs in EXO. M The lncRNA-miRNA-mRNA (miR-128-3p) regulatory network. Data are presented as Mean ± SD. Ns P > 0.05, *P<0.05, **P < 0.01, ***P < 0.001, ****P < 0.0001 vs (NC mimic + pcNC). # P < 0.05, ## P < 0.01, ### P < 0.001, #### P < 0.0001 vs (miR-128-3p mimic + pcNC).
Fig. 7
Fig. 7. Inhibition of miR-128-3p suppresses SLC7A11 transcription through the activation of the P38/JNK pathway.
A, B p38 MAPK/JNK/ERK phosphorylation levels in mouse ovaries. CF Western blot analysis of p38 MAPK/JNK/ERK phosphorylation levels in GCs transfected with the miR-128-3p inhibitor or mimic. G, H Phosphorylated-p38, p38, SLC7A11, GPX4, and NRF2 protein levels in GCs treated with the miR-128-3p inhibitor and/or SB203580 (p38 inhibitor, 20 μM). I, J Phosphorylated-JNK, JNK, SLC7A11, GPX4, and NRF2 protein levels in GCs treated with the miR-128-3p inhibitor and/or SP600125 (JNK inhibitor, 20 μM). K ChIP-qPCR analysis showing NRF2 binding to the SLC7A11 promoter. Data are presented as Mean ± SD. Ns P > 0.05, *P < 0.05, **P < 0.01, ****P < 0.0001.
Fig. 8
Fig. 8. Overexpression of miR-128-3p can restore PCOS-like features in mice.
A Schematic representation of the animal experimentation process in mice. B miR-128-3p expression as determined through qPCR following intrabursal injection of miR-128-3p AgomiR into mouse ovaries. C, D Body and ovary weights of mice in each group. E Representative estrous cycles after ovary-subcutaneous injection of miR-128-3p agomir. F Steroid sex hormone concentrations in mouse serum. G Corpus luteum and antral follicle counts following H&E staining. Scale bar: 300 μm. H, I oxidative stress- and ferroptosis-related gene mRNA expression. J Mouse litter size following intrabursal injection of miR-128-3p AgomiR into mouse ovaries. Data are presented as Mean ± SD. Ns P > 0.05, *P < 0.05, **P < 0.01, ***P < 0.001, ****P < 0.0001.

Similar articles

Cited by

References

    1. Walters KA, Gilchrist RB, Ledger WL, Teede HJ, Handelsman DJ, Campbell RE. New perspectives on the pathogenesis of PCOS: neuroendocrine origins. Trends Endocrinol Metab. 2018;29:841–52. - PubMed
    1. Norman RJ, Dewailly D, Legro RS, Hickey TE. Polycystic ovary syndrome. Lancet. 2007;370:685–97. - PubMed
    1. Zhang Q, Ren J, Wang F, Pan M, Cui L, Li M, et al. Mitochondrial and glucose metabolic dysfunctions in granulosa cells induce impaired oocytes of polycystic ovary syndrome through Sirtuin 3. Free Radic Biol Med. 2022;187:1–16. - PubMed
    1. Kumariya S, Ubba V, Jha RK, Gayen JR. Autophagy in ovary and polycystic ovary syndrome: role, dispute and future perspective. Autophagy. 2021;17:2706–33. - PMC - PubMed
    1. Stringer JM, Alesi LR, Winship AL, Hutt KJ. Beyond apoptosis: evidence of other regulated cell death pathways in the ovary throughout development and life. Hum Reprod update. 2023;29:434–56. - PMC - PubMed

LinkOut - more resources