. 2025 Feb 18;16(1):1751.
doi: 10.1038/s41467-025-56995-4.

A postzygotic GNA13 variant upregulates the RHOA/ROCK pathway and alters melanocyte function in a mosaic skin hypopigmentation syndrome

Affiliations

A postzygotic GNA13 variant upregulates the RHOA/ROCK pathway and alters melanocyte function in a mosaic skin hypopigmentation syndrome

Rana El Masri et al. Nat Commun. .

Abstract

The genetic bases of mosaic pigmentation disorders have increasingly been identified, but these conditions remain poorly characterised, and their pathophysiology is unclear. Here, we report in four unrelated patients that a recurrent postzygotic mutation in GNA13 is responsible for a recognizable syndrome with hypomelanosis of Ito associated with developmental anomalies. GNA13 encodes Gα13, a subunit of αβγ heterotrimeric G proteins coupled to specific transmembrane receptors known as G-protein coupled receptors. In-depth functional investigations revealed that this R200K mutation provides a gain of function to Gα13. Mechanistically, we show that this variant hyperactivates the RHOA/ROCK signalling pathway that consequently increases actin polymerisation and myosin light chains phosphorylation, and promotes melanocytes rounding. Our results also indicate that R200K Gα13 hyperactivates the YAP signalling pathway. All these changes appear to affect cell migration and adhesion but not the proliferation. Our results suggest that hypopigmentation can result from a defect in melanosome transfer to keratinocytes due to cell shape alterations. These findings highlight the interaction between heterotrimeric G proteins and the RHOA pathway, and their role in melanocyte function.


Conflict of interest statement

Competing interests: The authors declare no competing interests.

Figures
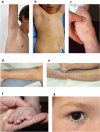
Fig. 1
Fig. 1. Clinical findings in GNA13 patients.
ae Patterns of hypopigmentation in GNA13 mosaic patients. a Phylloid, splash-like (Patient 1, aged 14, also showing biopsy scar on right arm); b Flag-shaped (triangular), splash-like (Patient 1, aged 5); c Splash-like (Patient 3); d, e (Patient 2) linear, spindle shaped; f Toe polysyndactyly (Patient 3); g Patchy hypotrichosis of lower eyelashes (Patient 4).
Fig. 2
Fig. 2. Position of the Gα13 R200K mutation identified in patients.
a 3D X-ray structure of Gα13. The N-terminal, C-terminal and switch I domain are represented in black, dark grey and blue respectively, while the R200 residue is indicated with a red dotted arrow. b Linear representation of Gα13 showing the position of the R200 residue. The same colour code used in part a is also shown here. c Alignment of Gα13 Switch I and surrounding region in different species showing in red the fully conserved arginine which corresponds to Gα13 R200. Identical residues are represented in black and the different ones in grey. d Alignment of Gα Switch I and surrounding region showing in red the fully conserved arginine that corresponds to Gα13 R200. Identical residues are represented in black and the different ones in grey.
Fig. 3
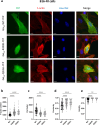
Fig. 3. Effect of the Gα13 R200K mutation identified in patients on actin organisation and cell morphology.
a Immunofluorescence images of Gα13 WT-YFP, Gα13 R200K-YFP or Gα13 Q226L-YFP (green) expressed in B16-F0 cells. The cells were labelled with phalloidin for visualising F-actin (red), and Hoechst for nuclei (blue). The scale bar is 10 µm. b Quantification of F-actin content that corresponds to the intensity of the red signal. Quantification of cell morphology parameters including perimeter (c), circularity (d) and solidity (e). Means +/− SEM are shown from 75, 103 and 92 Gα13 WT, R200K and Q226L expressing B16-F0 cells, respectively. ANOVA tests were performed. **P = 0.0014; ****P < 0.0001. All graphs shown are representative of eight independent experiments.
Fig. 4
Fig. 4. Effect of the Gα13 R200K mutation identified in patients on cytoskeletal proteins.
Immunofluorescence images of Gα13 WT-YFP, Gα13 R200K-YFP or Gα13 Q226L-YFP (green) expressed in B16-F0 cells. The cells were labelled with anti-pMLC (red) (a) or anti-vinculin (red) (c) antibodies, and Hoechst for nuclei (blue). The scale bar is 10 µm. b Quantification of the pMLC content that corresponds to the red signal intensity mean. Means +/− SEM are shown from 43, 53 and 47 Gα13 WT, R200K and Q226L expressing B16-F0 cells, respectively. ANOVA tests were performed. **P = 0.0022; ****P < 0.0001. Graph shown is representative of six independent experiments. d Quantification of the number of focal adhesions per cell that corresponds to the mean number of the red dots in each cell. Means +/− SEM are shown from 33, 76 and 48 Gα13 WT, R200K and Q226L expressing B16-F0 cells, respectively. ANOVA tests were performed. ***P = 0.0004; ****P < 0.0001. Graph shown is representative of three independent experiments.
Fig. 5
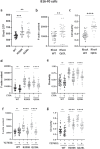
Fig. 5. Effect of the Gα13 R200K mutation identified in patients on RHOA signalling.
a Quantification of RHOA-GTP levels in Gα13 WT-YFP, Gα13 R200K-YFP or Gα13 Q226L-YFP expressing B16-F0 cells that correspond to the mean intensity of the signal generated from anti-GTP RHOA antibody labelling. Means +/- SEM are shown from 45, 42 and 34 Gα13 WT, R200K and Q226L expressing B16-F0 cells, respectively. ANOVA tests were performed. **P = 0.0058; ***P = 0.0006. Graph shown is representative of four independent experiments. Quantification of F-actin content (b) and circularity (c) in RHOA WT-GFP and RHOA Q63L-GFP expressing B16-F0 cells. Means +/− SEM are shown from 34 and 27 RHOA WT and Q63L expressing B16-F0 cells, respectively. ANOVA tests were performed. **P = 0.0058; ****P < 0.0001. All graphs shown are representative of three independent experiments. Quantification of F-actin content (d) and circularity (e) in Gα13 WT-YFP, Gα13 R200K-YFP or Gα13 Q226L-YFP expressing B16-F0 cells, upon RHOA inhibition treatment with CT04. Quantification of F-actin content (f) and circularity (g) in Gα13 WT-YFP, Gα13 R200K-YFP or Gα13 Q226L-YFP expressing B16-F0 cells, upon ROCK inhibition treatment with Y27632. For CT04 treatment, means +/− SEM are shown from 42, 50 and 46 Gα13 WT, R200K and Q226L untreated expressing B16-F0 cells, respectively, and from 37, 61 and 39 Gα13 WT, R200K and Q226L treated expressing B16-F0 cells, respectively. For Y27632 treatment, means +/− SEM are shown from 35 cells of each condition. ANOVA tests were performed. ****P < 0.0001. All graphs shown are representative of three independent experiments.
Fig. 6
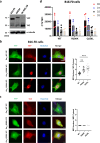
Fig. 6. Effect of the Gα13 R200K mutation on YAP/TAZ signalling and proliferation.
a Western blot analysis of YAP and TAZ expression in B16-F0, NHEM and SK-MEL-28 cells. Left: Immunofluorescence images of Gα13 WT-YFP, Gα13 R200K-YFP or Gα13 Q226L-YFP (green), YAP (b) or TAZ (c) (red) and the nucleus (Hoechst, blue) in B16-F0 cells. Right: Single cell quantifications of the ratios of YAP (b) or TAZ (c) Mean Fluorescence Intensity (MFI) in the nucleus over the cytosol. Means +/− SEM are shown from 10 to 20 cells of each condition. ANOVA tests were performed. **P = 0.0014; ***P = 0.0001. d Flow cytometry quantification of the CellTrace violet mean fluorescence intensity (CTV MFI) at days 1, 2 and 3 following CTV staining of B16-F0 cells at day 0. The dye dilution within days traces the multiple generations of the proliferating cells. Means +/− SEM from four independent experiments are shown.
Fig. 7
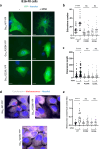
Fig. 7. Effect of the Gα13 R200K mutation on melanosomes transfer to keratinocytes.
a Immunofluorescence images of Gα13 WT-YFP, Gα13 R200K-YFP or Gα13 Q226L-YFP (green) expressed in B16-F0 cells in the absence or presence of MSH stimulation. Nuclei are stained with Hoechst (blue). The scale bar is 10 µm. The number of extensions (b) of the cells were counted and their length was also measured (c). Means +/− SEM are shown from 26 cells of each condition. d Immunofluorescence images of HaCaT keratinocytes co-cultured with Gα13 WT-YFP, Gα13 R200K-YFP or Gα13 Q226L-YFP expressing B16-F0 cells upon MSH stimulation. Keratinocytes are visualised by anti-cytokeratin antibody (white). Melanosomes are stained with anti-TRP1 antibody (red) and nuclei are stained by Hoechst staining (blue). e Quantification of melanosomes number (red dots) per HaCaT cells. Means +/− SEM are shown from 19 and 24 cells of each condition, in the absence or presence of MSH, respectively. ANOVA tests were performed. ****P < 0.0001. All graphs shown are representative of three independent experiments.

Similar articles

References

    1. Sybert, V. P. Hypomelanosis of Ito: a description, not a diagnosis. J. Invest. Dermatol.103, 141S–143S (1994). - PubMed
    1. Carmignac, V. et al. Clinical spectrum of MTOR-related hypomelanosis of Ito with neurodevelopmental abnormalities. Genet. Med.23, 1484–1491 (2021). - PMC - PubMed
    1. Vabres, P. et al. Postzygotic inactivating mutations of RHOA cause a mosaic neuroectodermal syndrome. Nat. Genet.51, 1438–1441 (2019). - PMC - PubMed
    1. Biesecker, L. G. et al. A dyadic approach to the delineation of diagnostic entities in clinical genomics. Am. J. Hum. Genet.108, 8–15 (2021). - PMC - PubMed
    1. Scott, G. Rac and rho: the story behind melanocyte dendrite formation. Pigment Cell Res15, 322–330 (2002). - PubMed

MeSH terms

Substances

LinkOut - more resources