. 2025 Feb 18;15(1):5851.
doi: 10.1038/s41598-025-89111-z.

Spatiotemporal dynamics of suspended sediment in coastal Mekong Delta: a hydrodynamic modelling approach under tropical monsoon climate

Affiliations

Spatiotemporal dynamics of suspended sediment in coastal Mekong Delta: a hydrodynamic modelling approach under tropical monsoon climate

Nguyen Ngoc An et al. Sci Rep. .

Abstract

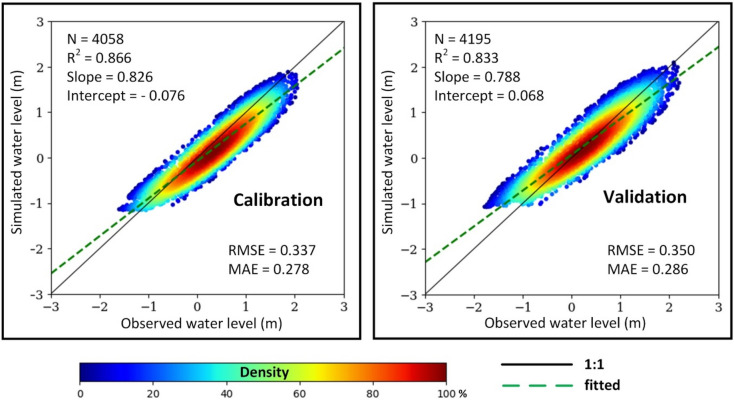
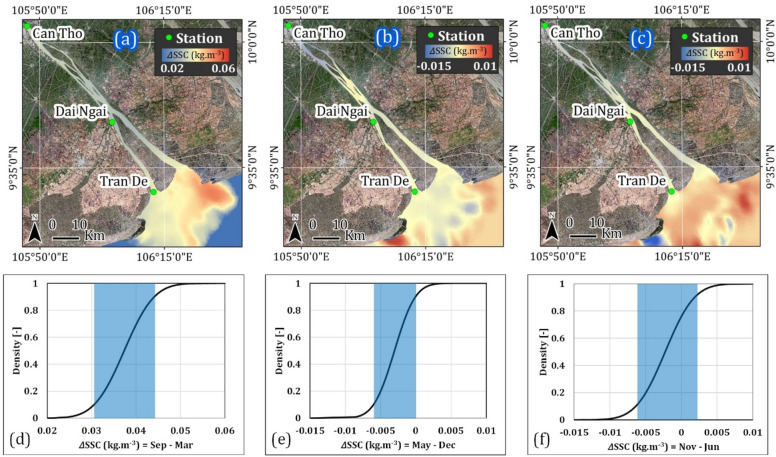
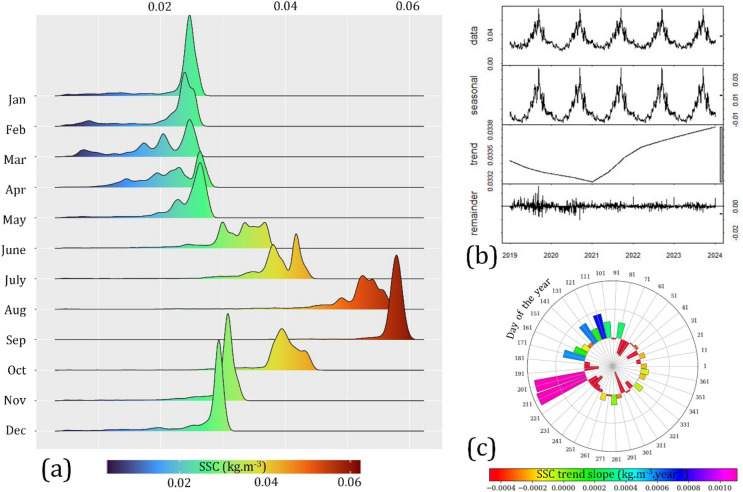
Suspended sediment concentration (SSC) plays a pivotal role in shaping coastal dynamics, impacting terrestrial and marine ecosystems. This study employed the hydrodynamic model MIKE21 to simulate hydrological runoff and sediment transport within the Mekong River's fluvial-marine continuum, the longest river in Southeast Asia currently challenged with escalating anthropogenic pressures and sea-level rise. By strategically selecting hourly observed data from various locations (river channel, coastal estuary) and periods (dry and rainy seasons) for model calibration and validation, we demonstrated the robust performance of the model simulation of both water levels (RMSE: 0.343 m) and SSC (RMSE: 0.006 kg.m-3). Spatiotemporal analysis of 2019-2023 revealed the pronounced sensitivity of water level, velocity, and flow direction under tropical monsoon regime. SSC time series decomposition further extracted seasonal amplitudes, while spatial patterns showed distinctly the lowest concentrations occurring in April and the highest in September annually. Furthermore, SSC upward trends were observed during low-flow periods, while downward trends predominated during high-flow periods. Our quantitative analysis offers a comprehensive understanding of hydrological processes within tropical monsoon coastal regions. These findings support the establishment of long-term monitoring frameworks to inform nature-based strategies for sustainable coastal development.


Conflict of interest statement

Declarations. Competing interests: The authors declare no competing interests.

Figures

Fig. 1
Fig. 1
Performance of water level simulation in calibration (left) and validation (right). All observed data collected by Tran De (TD) and Dai Ngai (DN) stations over 2019, among three dry months (February, March, and April) for calibration and three rainy months (August, September, and October) for validation.
Fig. 2
Fig. 2
Taylor diagram summarized the performance of water level simulation separated by individual station and period: dry season represents calibration (left), and rainy season represents validation (right). The black dotted line represents the average standard deviation of the water level observed in stations.
Fig. 3
Fig. 3
Performance of SSC estimation based on data collected in Can Tho (CT) stations in 2019 and 2021 used for calibration (left) and validation (right), respectively.
Fig. 4
Fig. 4
Illustrations of daily water level peaks and troughs during dry season (observed data used for model calibration), and rainy season (observed data used for model validation). Maps were generated by QGIS 3.16.0 (https://qgis.org).
Fig. 5
Fig. 5
A comparison of speed and direction of water flow during dry (top) and rainy (bottom) seasons. H and L represent high tide and low tide during the day. S and T represent spring tide and neap tide during the month. Maps were generated by QGIS 3.16.0 (https://qgis.org).
Fig. 6
Fig. 6
Typical monthly SSC calculated for the period 2019–2023. Maps were generated by QGIS 3.16.0 (https://qgis.org).
Fig. 7
Fig. 7
Typical spatial patterns (top) and corresponding cumulative distribution (bottom) represent SSC differences across specific periods: (a, d) during mid-rainy and mid-dry seasons (Sep–Mar); (b, e) the early and late dry seasons (May–Dec); (c, f) the early and late rainy seasons (Nov–Jan). The blue box indicates approximately 80% of pixel density. Maps were generated by QGIS 3.16.0 (https://qgis.org).
Fig. 8
Fig. 8
(a) Histogram density distribution of monthly SSC, (b) time series decomposition, and (c) 10-day trend slope.
Fig. 9
Fig. 9
Map showing the location of the study area (a) with zoom in different areas following bathymetry background and flexible mesh: (b) riverine, (c) transitional zone, and (d) coastal zone. Maps were generated by QGIS 3.16.0 (https://qgis.org).

References

    1. Neumann, B., Ott, K. & Kenchington, R. Strong sustainability in coastal areas: A conceptual interpretation of SDG 14. Sustain. Sci.12, 1019–1035 (2017). - PMC - PubMed
    1. Singh, G. G., Cottrell, R. S., Eddy, T. D. & Cisneros-Montemayor, A. M. Governing the land-sea interface to achieve sustainable coastal development. Front. Mar. Sci.8, 709947 (2021).
    1. Neumann, B., Vafeidis, A. T., Zimmermann, J. & Nicholls, R. J. Future coastal population growth and exposure to sea-level rise and coastal flooding: A global assessment. PLoS ONE10, e0118571 (2015). - PMC - PubMed
    1. Lansu, E. M. et al. A global analysis of how human infrastructure squeezes sandy coasts. Nat. Commun.15, 44659 (2024). - PMC - PubMed
    1. Grumbine, R. E., Dore, J. & Xu, J. Mekong hydropower: Drivers of change and governance challenges. Front. Ecol. Environ.10, 110146 (2012).

LinkOut - more resources