. 2025 Feb 18;16(1):1749.
doi: 10.1038/s41467-025-56951-2.

Doublecortin restricts neuronal branching by regulating tubulin polyglutamylation

Affiliations

Doublecortin restricts neuronal branching by regulating tubulin polyglutamylation

Muriel Sébastien et al. Nat Commun. .

Abstract

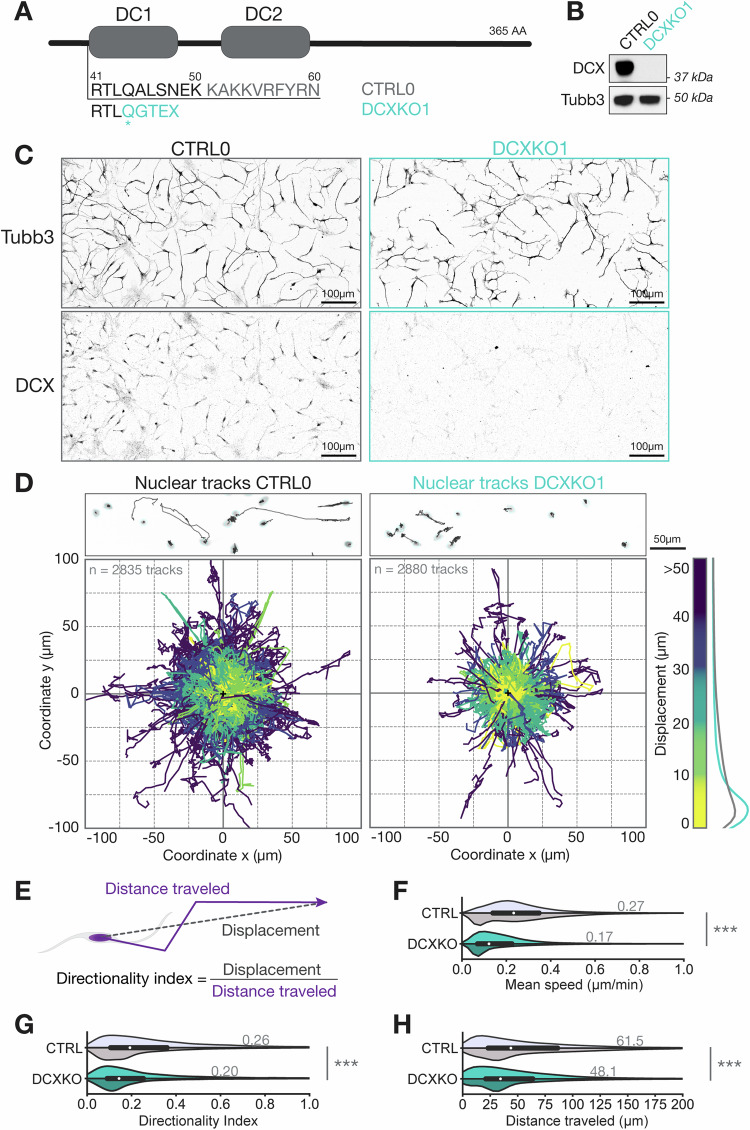
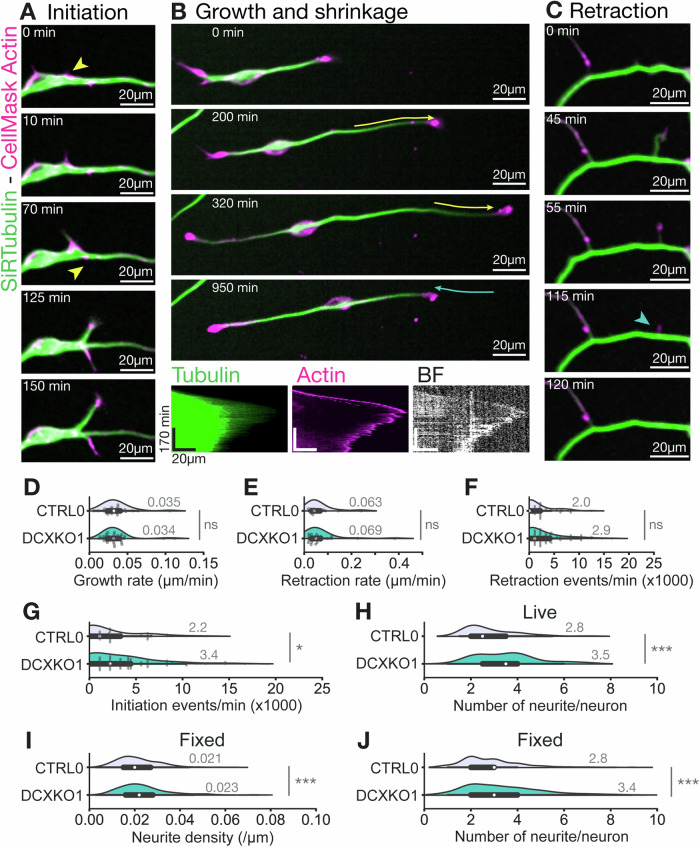
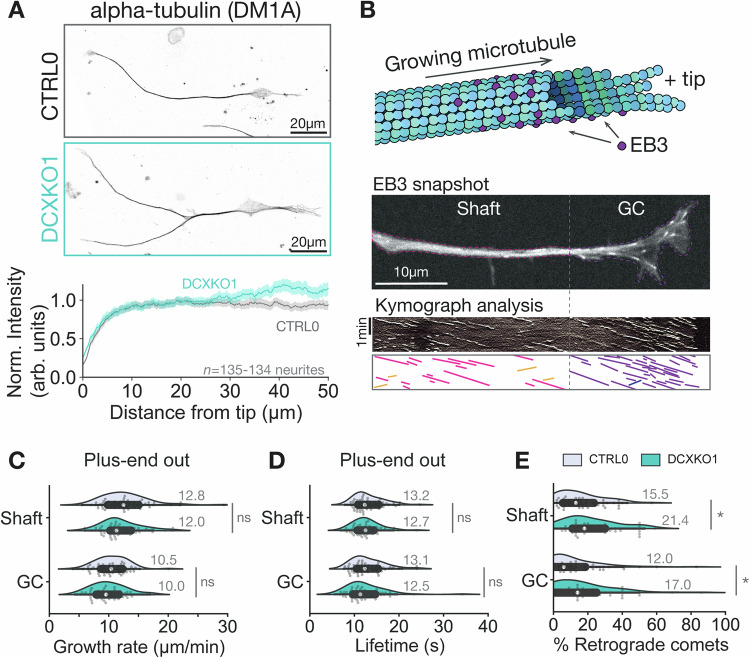
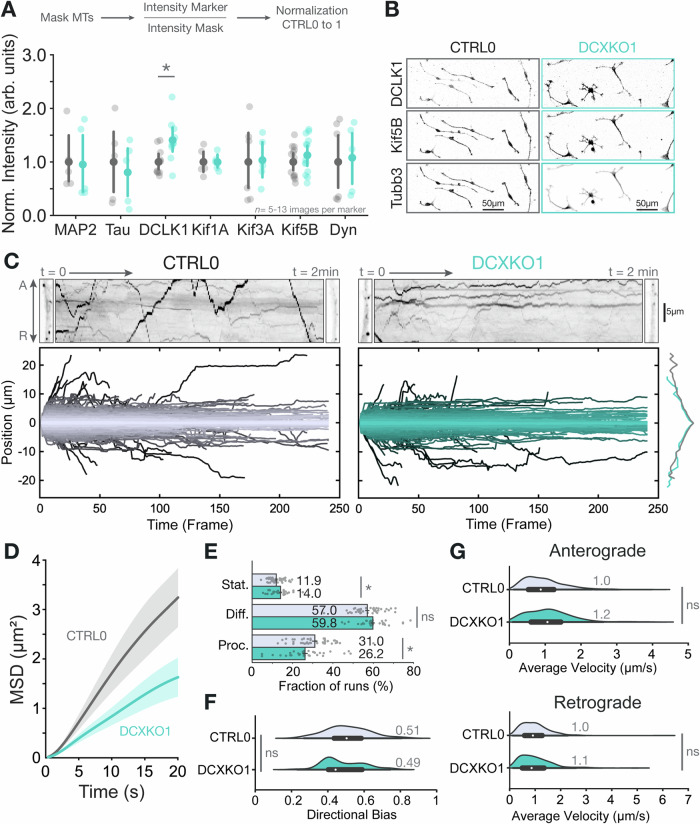
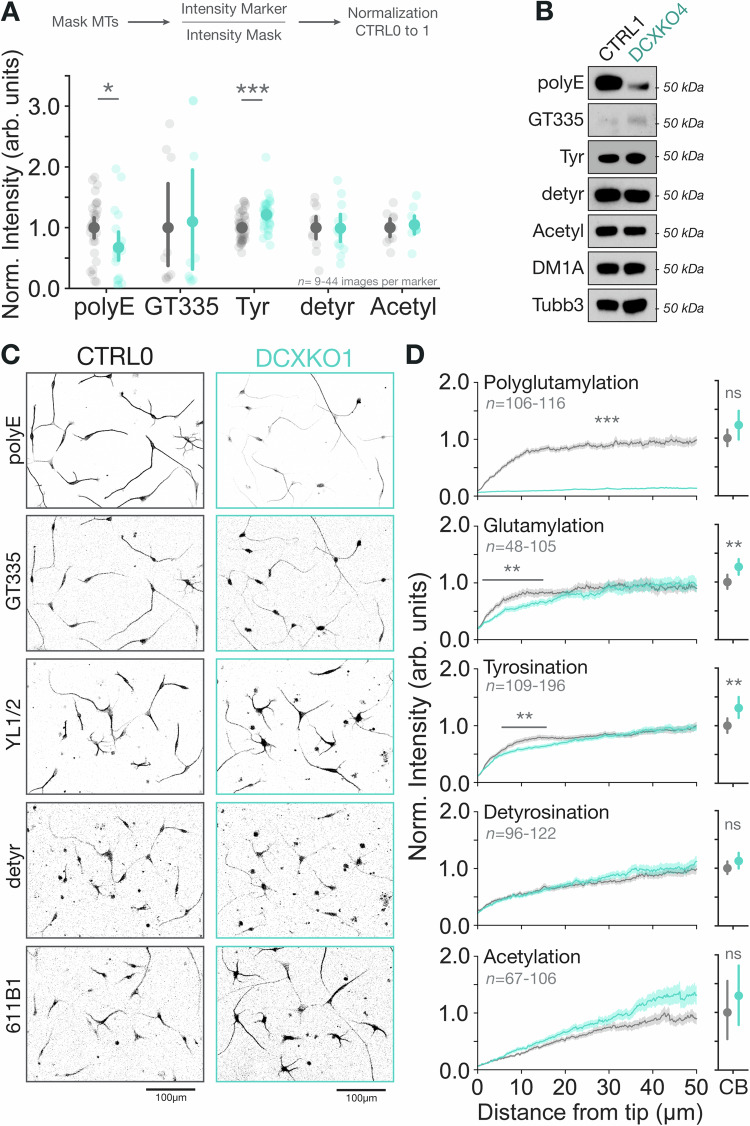
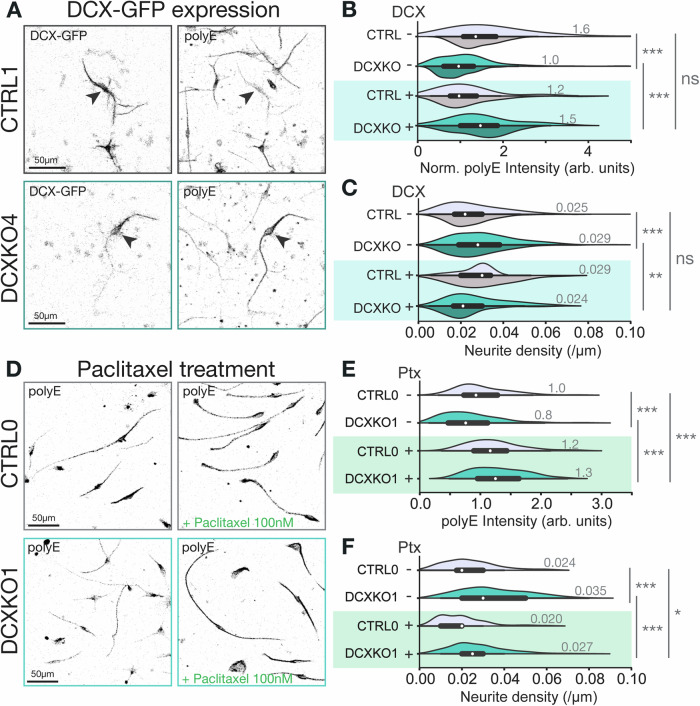
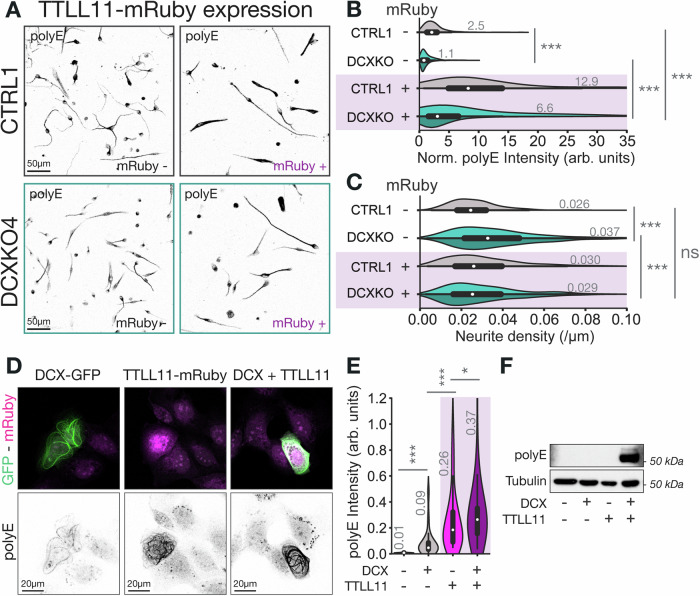
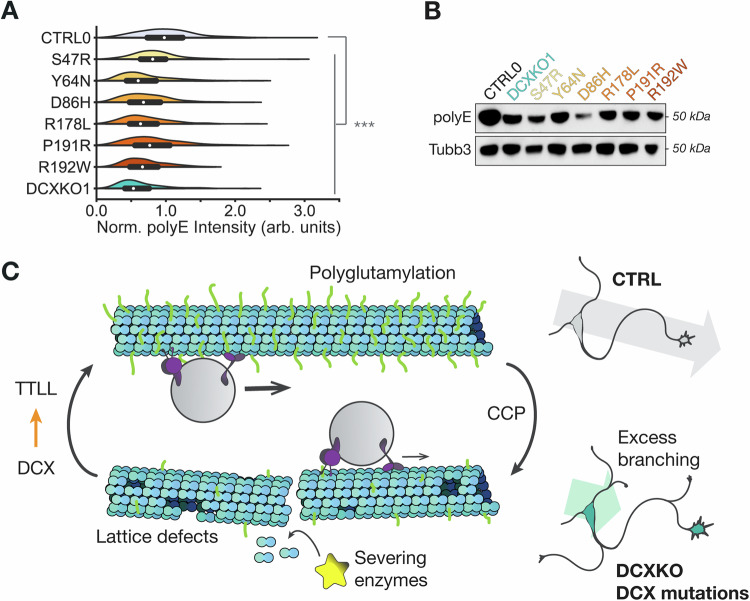
Doublecortin is a neuronal microtubule-associated protein that regulates microtubule structure in neurons. Mutations in Doublecortin cause lissencephaly and subcortical band heterotopia by impairing neuronal migration. We use CRISPR/Cas9 to knock-out the Doublecortin gene in induced pluripotent stem cells and differentiate the cells into cortical neurons. DCX-KO neurons show reduced velocities of nuclear movements and an increased number of neurites early in neuronal development, consistent with previous findings. Neurite branching is regulated by a host of microtubule-associated proteins, as well as by microtubule polymerization dynamics. However, EB comet dynamics are unchanged in DCX-KO neurons. Rather, we observe a significant reduction in α-tubulin polyglutamylation in DCX-KO neurons. Polyglutamylation levels and neuronal branching are rescued by expression of Doublecortin or of TTLL11, an α-tubulin glutamylase. Using U2OS cells as an orthogonal model system, we show that DCX and TTLL11 act synergistically to promote polyglutamylation. We propose that Doublecortin acts as a positive regulator of α-tubulin polyglutamylation and restricts neurite branching. Our results indicate an unexpected role for Doublecortin in the homeostasis of the tubulin code.


Conflict of interest statement

Competing interests: The authors declare no competing interests.

Figures

Fig. 1
Fig. 1. Nuclear mobility is impaired in DCX-KO cortical neurons.
A DCX contains two microtubule binding domains, DC1 and DC2. DCX-KO cells were obtained by indels introduced in Dcx’s gene sequence before DC1. CTRL0 and DCXKO1 amino acid sequences are shown from residue 41–60. The asterisk shows the indel location and the resulting amino acid sequence in DCXKO1 (cyan). B Immunoblots representative of 3 experiments, showing CTRL0 and DCXKO1 neuron lysates at 3 days of differentiation (DIV3), stained with antibodies against β3-Tubulin (Tubb3) and DCX. C CTRL0 and DCXKO1 neurons representative of 4 experiments stained for Tubb3 and DCX at DIV3. D (top panel) Still images of live neurons with a nuclear dye. Nuclei detected by Trackmate are circled (light blue), and their trajectories over the 8 h period of imaging are shown (gray). (Bottom panel) Position plots showing a sample of trajectories extracted from CTRL0 and DCXKO1 nuclei tracking. The first timepoint of all tracks is (0,0). Tracks are color-coded according to the displacement of the nucleus. Distribution of displacement for both genotypes are shown on the right end side of the panel. E Schematics showing the displacement, distance traveled, and directionality index parameters. F Distribution of mean speed achieved by CTRL and DCXKO nuclei during the imaging period. G Distribution of directionality index or efficiency of the trajectory for CTRL and DCXKO nuclei. Higher directionality indexes indicate more unidirectional movements. H Distribution of distance traveled by CTRL and DCXKO nuclei during the imaging period. For (FH) Violin plots are split between the two control (CTRL0, light gray, and CTRL1, dark gray) and two DCXKO (DCXKO1, cyan, and DCXKO4, dark cyan) lines used in this study. These three plots were cut-off to better show the main population, but the maximum values for distance traveled, mean speed, and directionality index are 497 µm, 2.7 µm/min and 1 respectively. n = 21826 tracks for CTRL0, 24801 tracks for CTRL1, 6461 tracks for DCXKO1 and 14,837 tracks for DCXKO4. Each line was used in 3 experiments, tracks with less than 30 min of imaging time were excluded from the dataset. Statistical analysis was performed using the Kruskal-Wallis non parametric H test: ***p < 0.001. p-values are detailed in Supplementary Table 1.
Fig. 2
Fig. 2. DCX-KO neurons establish more branches through increased rates of initiation.
Images representative of 3 experiments, showing a neurite initiation (A), growth/shrinkage (B) and retraction (C) events in a CTRL0 neuron recorded after incubation with tubulin and actin binding dyes: SiR-tubulin (green) and Cellmask actin (magenta). Yellow arrowheads show actin protrusions where a new neurite is initiated. cyan arrowheads show the remains of a neurite retracting completely. Yellow arrows show growth events and cyan arrows show retraction events. These events were used for calculation of growth and retraction speed (D, E), by measuring neurite length and lifetime on kymographs. An example kymograph is shown in the bottom panel in (B) with brightfield and fluorescence imaging. D Distribution of neurite growth rate in CTRL0 and DCXKO1 neurons. E Distribution of neurite retraction rate in CTRL0 and DCXKO1 neurons. For (D, E), n = 26 CTRL0 and 38 DCXKO1 events, from 2 independent experiments. Statistical analysis was performed using a Mann-Whitney U test: ns, nonsignificant. F Distribution of the number of neurite retraction events/min seen in CTRL0 and DCXKO1 neurons. Cells showing no retraction events were included in the analysis, but the points were not represented on the plot. G Distribution of the number of neurite initiation events/minute per neuron in CTRL0 and DCXKO1 neurons. Cells showing no initiation events were included in the analysis, but the points were not represented on the plot. H Number of neurites found per neuron in CTRL0 and DCXKO1 neurons. For (FH), n = 68 CTRL0 and 93 DCXKO1 neurons from 2 independent experiments. Statistical analysis was performed using a Mann-Whitney U test: ns nonsignificant, *p < 0.05, ***p < 0.001. I Distribution of neurite density per neuron for CTRL0 and DCXKO1 neurons in fixed samples. J Distribution of neurite number per neuron for CTRL0 and DCXKO1 neurons in fixed samples. For (I, J), n = 323 CTRL0 and 351 DCXKO1 neurons from 3 independent experiments. Statistical analysis was performed using a Mann-Whitney U test: ***p < 0.001. p-values are detailed in Supplementary Table 1.
Fig. 3
Fig. 3. Microtubule dynamics are unaffected in DCX-KO neurons.
A (Top) Immunostaining representative of 3 experiments showing CTRL0 and DCXKO1 neurons at DIV3 with an α-Tubulin (DM1A) specific antibody, and (Bottom) mean intensity profile found in the distal tip of neurons from both genotypes, SEM are shown in lighter gray (CTRL0) and lighter cyan (DCXKO1). Images included in the analysis are from n = 135 CTRL0 neurites and n = 134 DCXKO1 neurites from 3 experiments. B Schematics of the experimental procedure and analysis method for measuring microtubule dynamics. NPCs are electroporated with the plus-tip marker EB3-mCherry, and neurons are imaged at DIV3. Each comet is assigned to a domain (Shaft or growth cone (GC)), and its characteristics are measured: length, lifetime, growth rate, and direction. The EB3 snapshot and kymograph image are representative of 4 similar experiments, (C) Distribution of growth rates for plus end out comets in shaft or growth cone of CTRL0 and DCXKO1 neurons. D Distribution of lifetimes for plus end out comets in shaft or growth cone of CTRL0 and DCXKO1 neurons. E Distribution of the proportion (%) of minus end out (retrograde) comets in the shaft and growth cone of CTRL0 and DCXKO1 neurons. For clarity reasons, datapoints at 0 are not shown, but are included in the analysis. For (CE), n = 63 CTRL0 and n = 63 DCXKO1 cells from 4 experiments. Statistical analysis was performed using the Mann-Whitney non parametric U test: ns nonsignificant, *p < 0.05. p-values are detailed in Supplementary Table 1.
Fig. 4
Fig. 4. DCX-KO neurons show altered DCLK1 localization and lysosome motility.
A Compared mean intensity for MAP2, Tau, DCLK1, Kif1A, Kif3A, Kif5B, and Dynein in CTRL0 or DCXKO1 DIV3 immuno-stained neurons. The analysis pipeline is shown above the plot: a mask of the microtubules (MTs) was made, and the intensity of the marker was normalized to the intensity of the mask and to the control condition. Each transparent point represents a single image, while the opaque points show mean values, error bars represent the confidence intervals. Analyses are from n = 5, 5, 10, 5, 6,13, 6 CTRL0 images or 5, 5, 10, 5, 5, 13, 5 DCXKO1 images (MAP2, Tau, DCLK1, Kif1A, Kif3A, Kif5B, and Dynein respectively) from 2–4 experiments. Statistical analysis was performed using the Mann-Whitney non parametric U test: *p < 0.05. B Images representative of 3 experiments showing CTRL0 and DCXKO1 DIV3 neurons stained for DCLK1, Kif5B and Tubb3. C (Top) Representative still images chosen from 3 experiments showing CTRL0 and DCXKO1 straight neurite sections after incubation with the Lysotracker dye, and 2 min kymographs of those same sections. A = anterograde, and R = retrograde. (Bottom) Position plots for lysosomes detected using Trackmate during the 241 frames for CTRL0 and DCXKO1 neurons. The distribution of these positions was also plot and is represented on the right end side of the position plots. D Mean squared displacement (MSD) of lysosomes inside CTRL0 and DCXKO1 neurites. Data are presented as mean values ± SEM. E Proportion of tracked cargos that are either stationary (Stat.), Diffusive (Diff.) or Processive (Proc.). Data are presented as mean values ± SEM. Each point represents a single neuron. F Directional bias of lysosome cargos in CTRL0 and DCXKO1 neurons, where 0 corresponds to retrograde only and 1 corresponds to anterograde only. For D-F, n = 41 control and 30 DCXKO1 neurons from 3 independent experiments. Statistical analysis was performed using the Student’s t-test: ns nonsignificant, *p < 0.05. G Violin plots of the average velocity for anterograde and retrograde displacement of lysotracker cargos in CTRL0 and DCXKO1 DIV3 neurons. n = 1828 tracks for control and 1131 for DCXKO1 from 3 independent experiments. Statistical analysis was performed using the Student’s t-test: ns nonsignificant. p-values are detailed in Supplementary Table 2.
Fig. 5
Fig. 5. DCX-KO disrupts microtubule polyglutamylation.
A Compared mean intensity for polyglutamylation (polyE), glutamylation (GT335), tyrosination (Tyr), detyrosination (detyr), and acetylation (Acetyl) in CTRL0 or DCXKO1 DIV3 immunostained neurons. The analysis pipeline is shown above the plot: a mask of the microtubules (MTs) was made, and the intensity of the marker was normalized to the intensity of the mask and to the control condition. Each transparent point represents a single image, while the opaque points show mean values, error bars represent the confidence intervals. Plots are from n = 31, 9, 44, 12, 10 CTRL0 images or 21, 9, 39, 12, 10 DCXKO1 images (polyE, GT335, Tyr, detyr, Acetyl respectively) from at least 3 experiments. Statistical analysis was performed using the Mann-Whitney non parametric U test: *p < 0.05, ***p < 0.001. B Immunoblots representative of 3 experiments showing the relative post-translational modifications levels in CTRL1 and DCXKO4 DIV3 neurons. The same samples were loaded on different gels for each antibody. C Images representative of at least 3 experiments showing CTRL0 and DCXKO1 neurons stained for PTMs with the following antibodies: polyE, GT335, YL1/2, detyr, 611B1. D Intensity profiles for the PTMs levels in distal neurites and cell bodies (CB) of CTRL0 and DCXKO1 DIV3 neurons. Data are presented as mean values with error bars representing the SEM for neurites, and the confidence interval for CB. Plots are from n = 106, 48, 109, 96, 67 CTRL0 and 116, 105, 196, 122, 106 DCXKO1 neurites, and n = 66, 34, 90, 42, 23 CTRL0 and 45, 41, 69, 36, 33 DCXKO1 cell bodies (polyE, GT335, Tyr, detyr, and Acetyl respectively) from at least 3 experiments. Statistical analysis was performed using the Mann-Whitney non parametric U test: ns nonsignificant, **p < 0.01, ***p < 0.001. p-values are detailed in Supplementary Table 2.
Fig. 6
Fig. 6. DCX reduces neurite numbers by increasing tubulin polyglutamylation levels.
A Images representative of 3 experiments showing CTRL1 and DCXKO4 DIV3 neurons electroporated with DCX-GFP and stained for polyglutamylation. The arrowheads are showing the same cell in both channels (GFP, and polyE). B Violin plots showing the polyglutamylation (polyE) intensity normalized by Tubb3 intensity in CTRL and DCXKO DIV3 neurons with (+ or blue background) or without (− or white background) DCX-GFP electroporation. C Violin plot showing the neurite density in CTRL and DCXKO DIV3 neurons with or without DCX-GFP electroporation. For (B, C), the analysis included n = 97 CTRL0 (light gray), 178 CTRL1 (dark gray), 225 DCXKO1 (cyan), 171 DCXKO4 (dark cyan), 11 CTRL0 + DCX-GFP, 34 CTRL1 + DCX-GFP, 38 DCXKO1 + DCX-GFP, and 45 DCXKO4 + DCX-GFP neurons from 3 experiments. These two plots were cut-off to better show the main population, but the maximum values for polyE intensity, and neurite density are 9.4 (arb. units), 0.156 neurite/µm respectively. Statistical analysis was performed using the Mann-Whitney non parametric U test: ns nonsignificant, **p < 0.01, ***p < 0.001. p-values are detailed in Supplementary Table 3. D Images representative of 2 experiments showing CTRL0 and DCXKO1 DIV3 neurons stained for polyglutamylation (polyE) after 48 h in regular media or 48 h in media supplemented with 100 nM paclitaxel. E Violin plots showing the polyglutamylation (polyE) intensity in CTRL0 and DCXKO1 DIV3 neurons with (+ or green background) or without (− or white background) treatment with paclitaxel. F Violin plots showing the neurite density in CTRL0 and DCXKO1 DIV3 neurons with or without treatment with paclitaxel. For (E, F), images included in the analysis are from n = 84 CTRL0, 172 DCXKO1, 120 CTRL0+paclitaxel and 160 DCXKO1 + paclitaxel neurons from 2 experiments. Statistical analysis was performed using the Mann-Whitney non parametric U test: *p < 0.05, ***p < 0.001. p-values are detailed in Supplementary Table 3.
Fig. 7
Fig. 7. DCX and TTLL11 synergize to regulate polyglutamylation levels.
A Images representative of 6 experiments showing CTRL1 and DCXKO4 DIV3 neurons control (mRuby-) or electroporated with TTLL11-mRuby (mRuby +) and stained for polyglutamylation (polyE). B Violin plots showing the polyglutamylation (polyE) intensity in CTRL1 and DCXKO DIV3 neurons with (+ or purple background) or without (− or white background) TTLL11-mRuby electroporation. DCXKO1 and DCXKO4 are shown as split violins, with DCXKO1 in cyan (top) and DCXKO4 in dark cyan (bottom). C Violin plot showing the neurite density in CTRL1 and DCXKO DIV3 neurons with or without TTLL11-mRuby electroporation. For B-C, images included in the analysis are from n = 372 CTRL1 (dark gray), 380 DCXKO1 (cyan), 654 DCXKO4 (dark cyan), 199 CTRL1 + TTLL11-mRuby, 186 DCXKO1 + TTLL11-mRuby and 408 DCXKO4 + TTLL11-mRuby neurons from 6 independent experiments. These two plots were cut-off to better show the main population, but the maximum values for polyE intensity, and neurite density are 91.6 (arb. units), 0.143 neurite/µm respectively. Statistical analysis was performed using the Mann-Whitney non parametric U test: ns nonsignificant, ***p < 0.001. p-values are detailed in Supplementary Table 4. D Images representative of 3 experiments showing U2OS cells transfected respectively with DCX-GFP (green), TTLL11-mRuby (magenta) or DCX-GFP and TTLL11-mRuby together. All conditions were fixed and stained for polyglutamylation (polyE). E Violin plots showing the quantification of polyglutamylation (polyE) levels in U2OS transfected cells as in (D). Images included in the analysis are from n = 27 control (untransfected), 58 DCX-GFP, 46 TTLL11-mRuby, and 95 DCX + TTLL11 cells from 3 experiments. This plot was cut-off to better show the main population, but the maximum values for polyE intensity is 2.46 (arb. units). Statistical analysis was performed using the Mann-Whitney non parametric U test: *p < 0.05, ***p < 0.001. p-values are detailed in Supplementary Table 4. F Immunoblot representative of 3 experiments showing U2OS cells untransfected or transfected respectively with DCX-GFP, TTLL11-mRuby or DCX + TTLL11, and stained for polyglutamylation (polyE) and tubulin (DM1A). DCX and TTLL11 transfections were visually checked before lysis of the samples. The same samples were loaded on multiple gels for each antibody.
Fig. 8
Fig. 8. Regulation of the tubulin code by the MAP DCX.
A Violin plots showing the polyglutamylation (polyE) intensity in stained DIV3 neurons carrying the following DCX patient mutations: S47R, Y64N, D86H, R178L, P191R, R192W, and compared to CTRL0 and DCXKO1. Images included in the analysis are from n = 384 CTRL0, 314 D86H, 177 DCXKO1, 323 P191R, 260 R178L, 287 R192W, 215 S47R, 289 Y64N neurons from 3 experiments. Statistical analysis was performed using the Mann-Whitney non-parametric U test: ***p < 0.001. p-values are detailed in Supplementary Table 4. B Immunoblots representative of 3 experiments, showing polyglutamylation levels in CTRL0, DCXKO1 and mutant DIV3 neurons (DC1: S47R, Y64N, D86H, DC2: R178L, P191R, R192W). The same samples were loaded on different gels for both antibodies. C Control neurons have high polyglutamylation levels. In this context, DCX activates TTLLs leading to two molecular phenotypes in DCX-KO neurons: a decrease in polyglutamylation of the microtubule lattice and an impeded cargo motility. The addition or association of these two mechanisms results in an excessive production of neurite and a decrease in migration speed and efficacy in DCX-KO and mutated neurons.

Similar articles

Cited by

References

    1. Herculano-Houzel, S. The human brain in numbers: a linearly scaled-up primate brain. Front. Hum. Neurosci.3, 31 (2009). - PMC - PubMed
    1. Rakic, P. Mode of cell migration to the superficial layers of fetal monkey neocortex. J. Comp. Neurol.145, 61–83 (1972). - PubMed
    1. Nadarajah, B. & Parnavelas, J. G. Modes of neuronal migration in the developing cerebral cortex. Nat. Rev. Neurosci.3, 423–432 (2002). - PubMed
    1. Kapitein, L. C. & Hoogenraad, C. C. Building the neuronal microtubule cytoskeleton. Neuron87, 492–506 (2015). - PubMed
    1. Dogterom, M., Kerssemakers, J. W., Romet-Lemonne, G. & Janson, M. E. Force generation by dynamic microtubules. Curr. Opin. Cell Biol.17, 67–74 (2005). - PubMed

MeSH terms

LinkOut - more resources