. 2025 Apr;9(4):599-612.
doi: 10.1038/s41559-025-02637-3. Epub 2025 Feb 18.

Archaean green-light environments drove the evolution of cyanobacteria's light-harvesting system

Affiliations

Archaean green-light environments drove the evolution of cyanobacteria's light-harvesting system

Taro Matsuo et al. Nat Ecol Evol. 2025 Apr.

Abstract

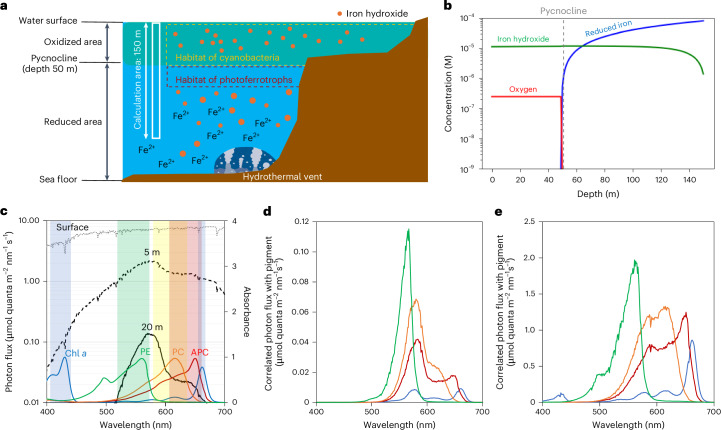
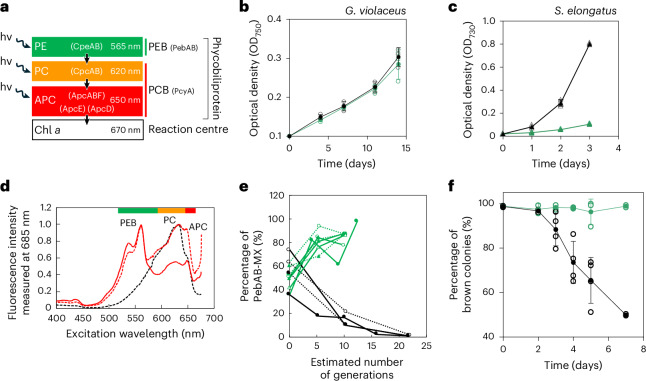
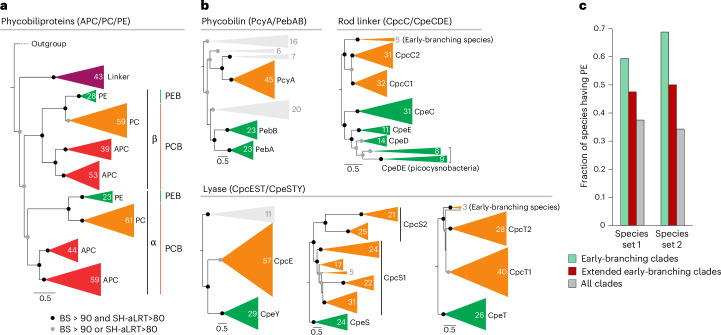
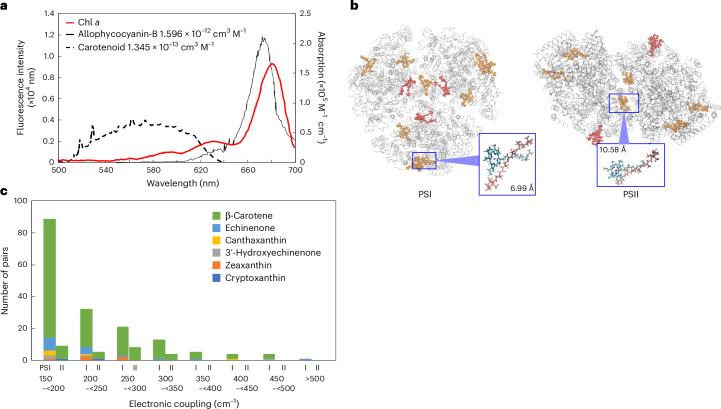
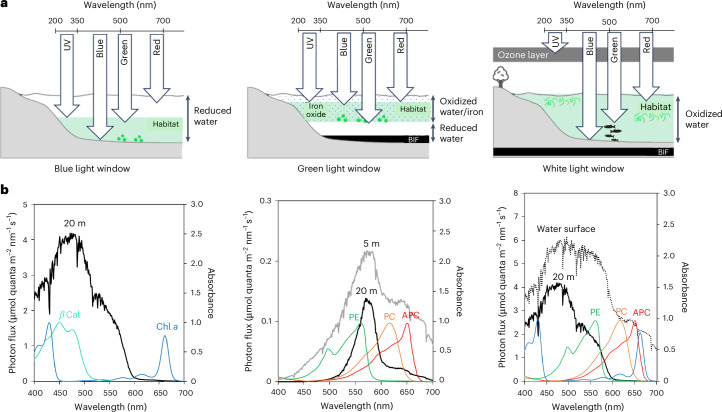
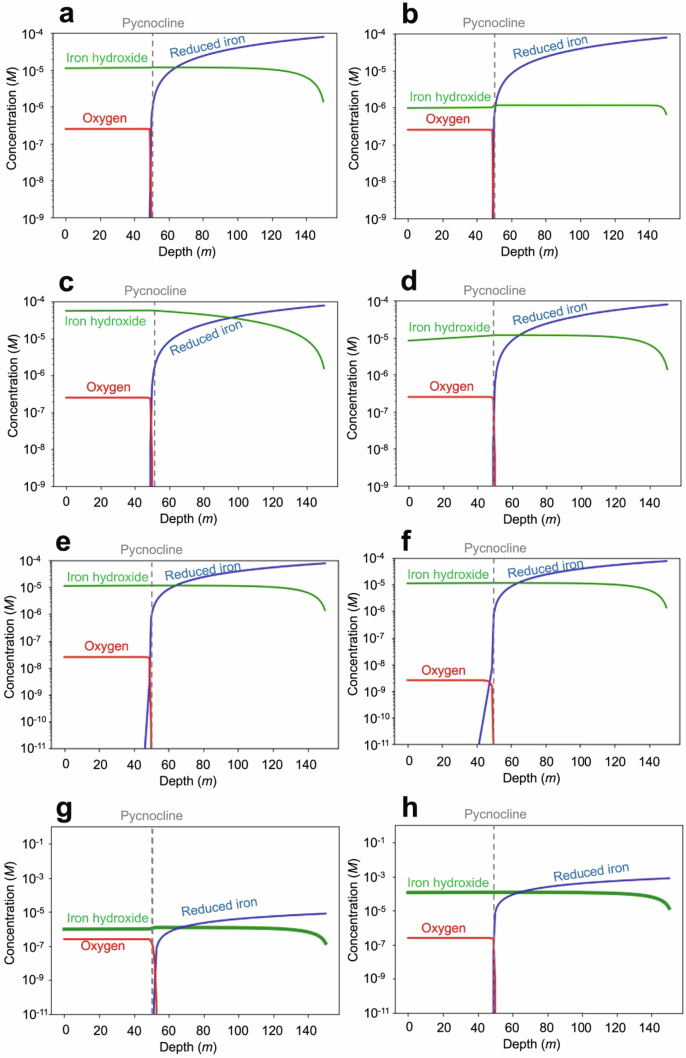
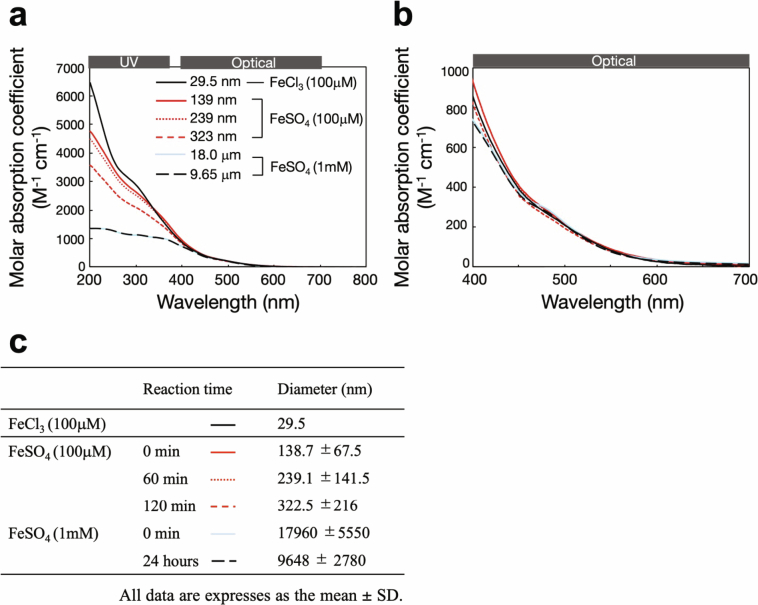
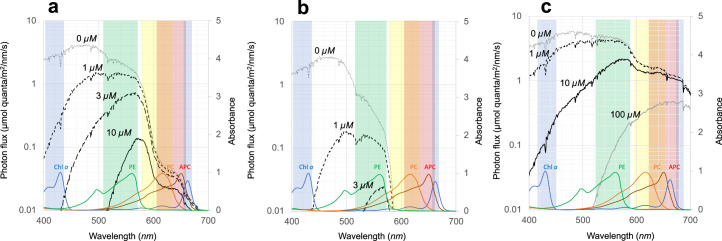
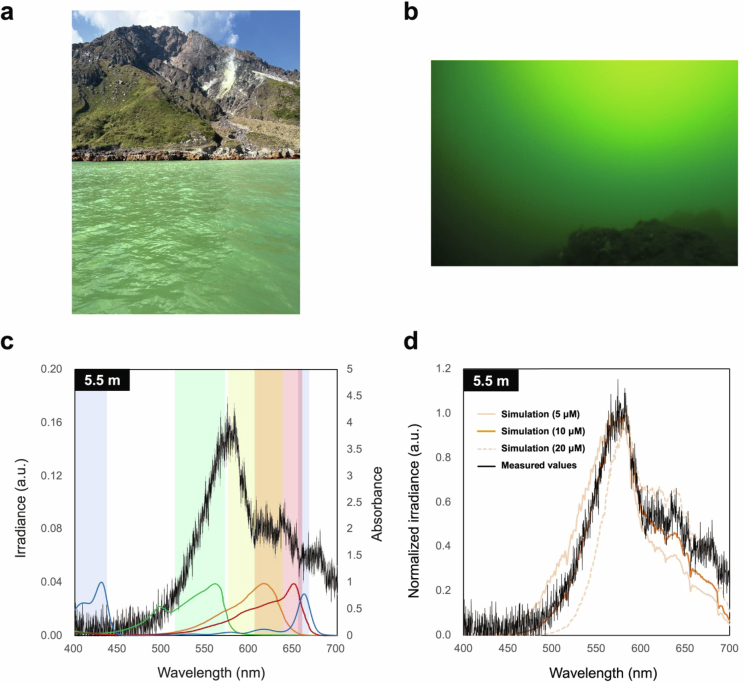
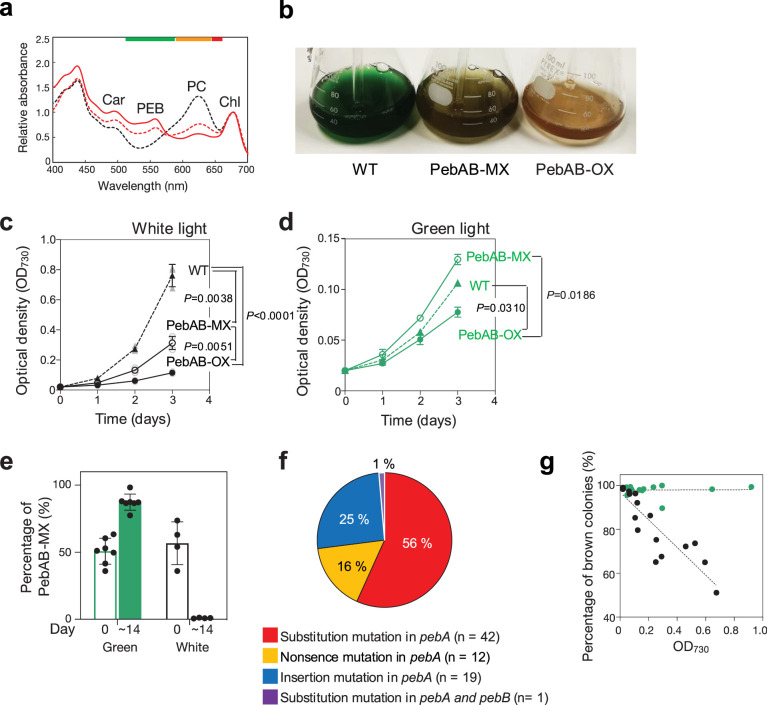
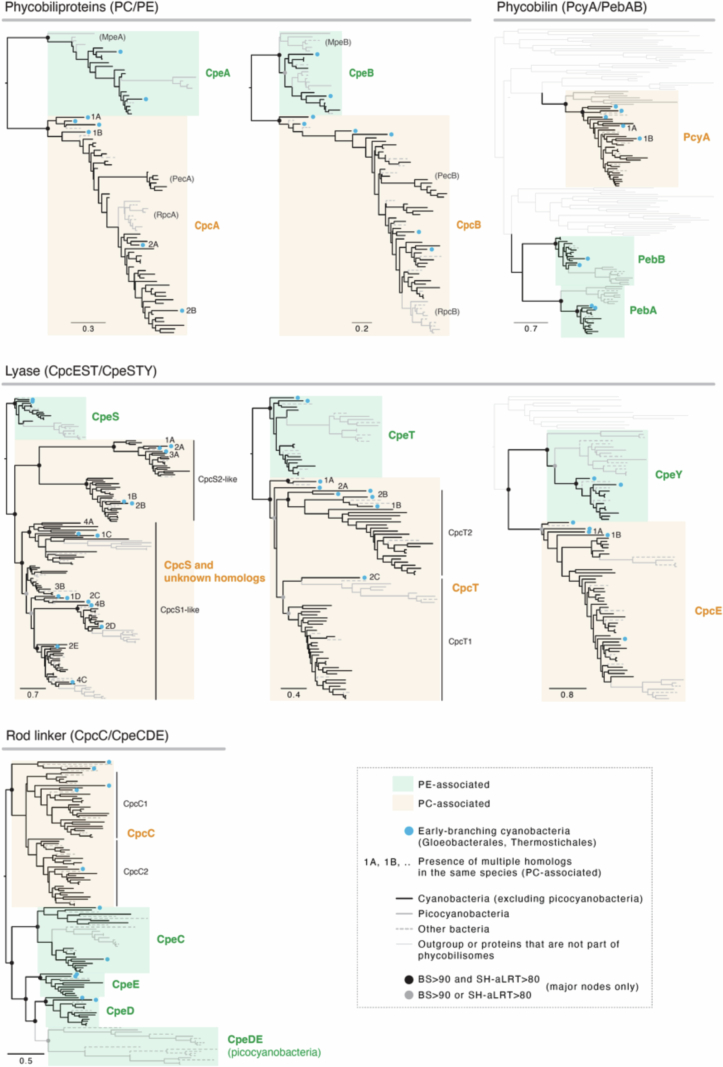
Cyanobacteria induced the great oxidation event around 2.4 billion years ago, probably triggering the rise in aerobic biodiversity. While chlorophylls are universal pigments used by all phototrophic organisms, cyanobacteria use additional pigments called phycobilins for their light-harvesting antennas-phycobilisomes-to absorb light energy at complementary wavelengths to chlorophylls. Nonetheless, an enigma persists: why did cyanobacteria need phycobilisomes? Here, we demonstrate through numerical simulations that the underwater light spectrum during the Archaean era was probably predominantly green owing to oxidized Fe(III) precipitation. The green-light environments, probably shaped by photosynthetic organisms, may have directed their own photosynthetic evolution. Genetic engineering of extant cyanobacteria, simulating past natural selection, suggests that cyanobacteria that acquired a green-specialized phycobilin called phycoerythrobilin could have flourished under green-light environments. Phylogenetic analyses indicate that the common ancestor of modern cyanobacteria embraced all key components of phycobilisomes to establish an intricate energy transfer mechanism towards chlorophylls using green light and thus gained strong selective advantage under green-light conditions. Our findings highlight the co-evolutionary relationship between oxygenic phototrophs and light environments that defined the aquatic landscape of the Archaean Earth and envision the green colour as a sign of the distinct evolutionary stage of inhabited planets.


Conflict of interest statement

Competing interests: The authors declare no competing interests.

Figures

Fig. 1
Fig. 1. Underwater green-light environment after the emergence of cyanobacteria and photoferrotrophs in the Archaean era.
a, Archaean water environment assumption for calculating iron hydroxide concentration. The green-shaded area represents the oxidized region, while the orange dots indicate iron hydroxide particles. The habitats of cyanobacteria (yellow dashed area) and photoferrotrophs (brown dashed area) are inferred to have been separated into oxidized and reduced zones, respectively. Reduced iron from thermal vents at the sea floor was transformed into iron hydroxide by photoferrotrophic and cyanobacterial activities. The white solid vertical column indicates the calculation area, a one-dimensional vertical column with a height of 150 m. b, Concentration of iron hydroxide (green), oxygen (red) and reduced iron (blue), with the depth of the pycnocline set at 50 m. c, Incident photon flux at the surface water (grey dotted line) and at depths of 5 m (black dashed line) and 20 m (black solid line). The pigment absorption spectra are superimposed: Chl a (blue line), PE (green line), PC (orange line) and APC (brown line). Background coloured regions in the figures denote the absorption wavelength ranges of different pigments. d,e, Correlation of incident photon flux with photosynthetic pigments at depths of 20 m (d) and 5 m (e). The colour code is the same as Fig. 1c.
Fig. 2
Fig. 2. Adaptation of cyanobacteria to the green-light window by PEB.
a, Conceptual diagram for energy transfer from PE to Chl a within phycobilisomes, consisting of phycobiliproteins (APC, PC and PE) and conjugated phycobilins (PEB and PCB). Individual components of phycobilisomes and phycobilin synthase were used for the phylogenetic analyses in this study: CpeAB, CpcAB, ApcABF and ApcD for phycobilisomes and PebAB and PcyA for phycobilin synthase. The green, orange and red colours correspond to the absorption wavelengths of PE, PC and APC, respectively. hν represents the energy of a photon with frequency ν. b,c, Growth of G. violaceus PCC 7421 (b) and S. elongatus PCC 7942 (c) cultures under white or green light. The growth of the culture is shown as the increase in the optical density of cells at 750 nm (OD750, G. violaceus) or 730 nm (OD730, S. elongatus). Cells were illuminated with 10 μmol m−2 s−1 (G. violaceus) or 40 μmol m−2 s−1 (S. elongatus) green light (green line) or white light (black line) LEDs. Values are represented as mean ± s.d. with raw data from three independent experiments. d, Low-temperature fluorescence excitation spectra of wild-type S. elongatus (black dashed line) and the transformant mild-expressing or overexpressing pebAB (PebAB-MX (red dashed line) or PebAB-OX (red solid line)). Fluorescence emission was monitored at 685 nm (mostly PSII fluorescence). The spectra were normalized at their emission peaks. e, Competition between PebAB-MX and wild-type cells under green light (green) or white light (black), plotted as a function of the estimated number of generations. The results for seven (green light) or four (white light) independent experiments are shown for each treatment as different lines and symbols. f, Fraction of brown colonies that yield PEB to all colonies of PebAB-OX under white and green light. Values are represented as mean ± s.d. from four (white light) or three (green light) independent experiments (closed circles) and raw data (open circles).
Fig. 3
Fig. 3. Evolutionary relationship of PC- and PE-associated proteins and change in the relative abundance of PE-bearing species in cyanobacteria.
a, Maximum likelihood phylogeny of phycobiliproteins APC (ApcABDF, red), PC (CpcAB, orange) and PE (CpeAB, green) and the core membrane linker (ApcE, purple). Corresponding phycobilins, PCB and PEB, are also shown. Greek letters indicate the two subunits of phycobiliproteins. The colour code is the same as Fig. 2a, except for ApcE. BS, bootstrap value; SH-aLRT, Shimodaira–Hasegawa approximate likelihood ratio test. b, Maximum likelihood phylogeny of other phycobilisome-associated proteins: phycobilin synthase, rod linker (connecting different phycobiliproteins) and lyase (conjugating phycobilins with phycobiliproteins). The subclade collapse in each tree is based on the distribution of corresponding paralogues in host cyanobacteria. Light grey indicates the outgroup or proteins that are not part of phycobilisomes. The green and orange colours represent the absorption wavelengths of PE- and PC-associated proteins, respectively. c, Fractions of PE-bearing cyanobacterial species in early-branching clades that branched by the end of the GOE (green), extended early-branching clades that additionally include the taxonomic groups of Acaryochloris marina MBIC11017, Synechococcus sp. PCC 6312 and Thermostichus lividus PCC 6715 (brown) and all extant clades (grey). Calculations were performed for the two distinct species sets, species set 1 (ref. ) and species set 2 (ref. ) (Methods).
Fig. 4
Fig. 4. Comparison of excitation energy transfer from carotenoids to chlorophylls in photosystems, as evaluated using quantum chemical analysis.
a, The absorption spectrum of Chl a (acceptor) and the fluorescence spectra of allophycocyanin-B and carotenoid (donor). The spectral overlaps between the fluorescence spectra of the donors and the absorption spectrum of the acceptor are shown. b, Structure of PSI (PDB code 5oy0) (left) and PSII (PDB code 7n8o) (right) from Synechocystis PCC 6803. The pairs of carotenoids and Chl a showing from the first-largest to the third-largest electronic coupling are drawn in stick mode in orange (β-carotene) or red (carotenoids other than β-carotene in cyanobacteria). The inset boxes show the zoomed-in views of a pair of β-carotene and Chl a exhibiting the largest electronic coupling and the intermolecular distances of these pairs are shown. c, Distribution of electronic couplings between Chl a and carotenoids in PSI and PSII of cyanobacteria (Synechocystis sp. PCC 6803). The number of pairs with electronic couplings >150 cm−1 is shown.
Fig. 5
Fig. 5. Three light windows for the habitats of photosynthetic organisms.
a, Left, Blue-light window before the emergence of photoferrotrophs and cyanobacteria. Reduced iron was assumed to be spread throughout the ocean. Centre, green-light window due to the formation of iron hydroxide through direct oxidation of reduced iron by photoferrotrophs and indirect oxidation through cyanobacterial-generated oxidized aquatic environment. Iron oxide particles (indicated by polka dots) could efficiently block the UV light, potentially expanding the habitat for photosynthetic organisms into shallow waters. Right, white-light windows after the GOE. The green-shaded region in each panel represents the favoured habitat for photosynthetic organisms from the perspective of blocking the harmful UV light. b, Comparison of the transmittance spectrum of the three light windows with the absorption spectra of pigments.
Extended Data Fig. 1
Extended Data Fig. 1. Concentrations of oxygen (red), reduced iron (blue), and iron hydroxide (green) in six different scenarios.
This figure illustrates the variations in concentrations across six cases, corresponding to the parameters of Models 1 (a), 2 (b), 3 (c), 4 (d), 5 (e), 6 (f), 7 (g), and 8 (h) as detailed in Extended Data Tables 1 and 2. Models 1 through 4 are characterized by different diffusivity in their upper and lower layers, all maintaining a standard oxygen concentration of 250 nM. In contrast, Models 5 – 6 and 7 – 8, while sharing the same diffusivity rates as Model 1, exhibit different oxygen concentrations of 25 and 2.5 nM and different reduced iron concentrations of 8 µM and 800 µM, respectively.
Extended Data Fig. 2
Extended Data Fig. 2. Spectra of the molar absorption coefficient determined on samples of iron hydroxide (a) between 200 and 800 nm or (b) between 400 and 700 nm and (c) the diameter of iron hydroxide as a function of the reaction time.
Note that the visible coefficient of iron hydroxide is unaffected by synthesis method and particle size, whereas the coefficient in the UV region increases as particle size decreases. Colloidal iron hydroxide was prepared by adding FeCl3 solution to boiling ultrapure water or by adding NaOH solution to FeSO4 solution. At each time after the preparation of iron hydroxide, the absorption spectra were measured using UV-VIS spectrometer equipped with an integrating sphere. The average particle diameter of iron hydroxide measured by the dynamic light scattering (DLS) method (100 mM FeCl3 and 100 mM FeSO4) or laser diffraction method (1 mM FeSO4) are shown for each reaction time. The absorption spectra and particle size of colloidal iron hydroxide prepared from FeCl3 were measured within 60 min after preparation.
Extended Data Fig. 3
Extended Data Fig. 3. Light windows for cyanobacterial habitats at different depths.
This figure depicts the incident photon fluxes in cyanobacterial habitats at depths of 20 meters (a), 50 meters (b), and 5 meters (c). Each habitat’s distribution adheres to a normal distribution with a standard deviation (sigma) of 5 meters. Grayscale lines indicate the light windows with different iron hydroxide concentrations: a gray dotted line for the open ocean (0 µM), and black dashed (1 µM), black long dashed (3 µM), solid black (10 µM), and gray lines (100 µM). The cyanobacterial habitat distribution was assumed to be a Gaussian distribution with a half-width of 5 meters. The light window calculations employed a weighted average approach, averaging transmitted photon flux according to the cyanobacterial habitat distribution, which served as the weighting function. Colored regions in the figures denote the absorption wavelength ranges of different pigments: Chl a (blue), PE (green), PC (orange), and APC (brown).
Extended Data Fig. 4
Extended Data Fig. 4. Correlation of photon fluxes with photosynthetic pigments at different depths and iron hydroxide concentrations.
a–d. Incident photon fluxes correlated with Chl a (blue), PE (green), PC (orange), and APC (red) at a depth of 20 meters. These panels (a: 0 µM, b: 1 µM, c: 3 µM, d: 10 µM iron hydroxide concentration) illustrate the interplay between light window and pigment absorption capabilities under varying iron hydroxide concentrations. The chosen depth of 20 meters aligns with the optimal habitat depth during the Archean era, as indicated by the previous research. e–g. Correlated incident photon fluxes at a depth of 50 meters for different iron hydroxide concentrations (e: 0 µM, f: 1 µM, g: 3 µM). This depth represents the typical pycnocline depth in the Pacific Ocean (see Supplementary Discussion 4). h-k. Correlated incident photon fluxes at a depth of 5 meters (h: 0 µM, i: 1 µM, j: 10 µM, k: 100 µM), highlighting how varying concentrations of iron hydroxide influence light absorption at this shallower depth.
Extended Data Fig. 5
Extended Data Fig. 5. Green-light window due to iron hydroxide in the sea around Iwo Jima.
a and b. The pictures of sea area (a) and underwater (b) around the Iwo Island within the Satsuma archipelago in Kyusyu, Japan. The underwater picture (b) was provided by the Japanese public broadcaster, Nippon Hoso Kyokai (NHK). c. Transmitted light spectrum measured on Iwo Jima at the depth of 5.5 meters. The median value of 10 measurements at the same location is the black line, and the standard deviation is the light gray line. The colored regions in the figures represent the absorption wavelength ranges of various pigments: Chl a (blue), PE (green), PC (orange), and APC (red), as in Fig. 3. d. Comparison of measured values at Iwo Jima with transmitted light spectrum calculated for an iron hydroxide concentration of 5, 10, and 20 μM. The calculated transmitted light spectrum is set at an equal depth of 5.5 meters. The irradiance just beneath the water surface at Iwo Jima, measured at approximately the same time, was used to calculate the transmitted light. Please note that each spectrum is normalized to the maximum irradiance value of 1 due to the specifications of the measurement device.
Extended Data Fig. 6
Extended Data Fig. 6. Distribution of cyanobacteria in seawater around Iwo Jima.
a. Cytograms of the orange and yellow/green fluorescence profile for samples collected from 0 (left) and 5.5 meters (right) depth at the sea area around Iwo Jima. There were one autotrophic nanoflagellates (ANF) group, cyanobacteria with the PC-only group and cyanobacteria with the PE group. Each group was divided into subpopulations having high or low pigments. b. Fraction of phytoplankton having high or low pigments calculated from the subpopulation of cytograms. c. Fluorescence excitation spectra of PE in the seawater around Iwo Jima. Two liters of seawater at a depth of 6 meters with a green light environment were filtered onto 47 mm Whatman GF/F filters. The filters were extracted in phosphate buffer, and the fluorescence of supernatant was measured using a spectrofluorometer. Excitation spectra of PUB appeared around 495 – 500 nm and PEB excitation spectra was around 540 – 560 nm. Emission was fixed at 605 nm.
Extended Data Fig. 7
Extended Data Fig. 7. Cellular absorption spectra and low-temperature fluorescence excitation spectra of G. violaceus PCC 7421 and S. elongatus PCC 7942.
a. Cellular absorption spectra of G. violaceus PCC 7421 (solid line) and S. elongatus PCC 7942 (dashed line). The spectra were normalized at the Chl a absorbance at 678 nm. b. Low-temperature fluorescence excitation spectra of G. violaceus PCC 7421 (solid line) and S. elongatus PCC 7942 (dashed line). Fluorescence emission was monitored at 690 nm (G. violaceus) and 685 nm (S. elongatus) (mostly PSII fluorescence for S. elongatus and mostly PSI and PSII fluorescence for G. violaceus). The spectra were normalized at their emission peaks.
Extended Data Fig. 8
Extended Data Fig. 8. Phenotypes and spontaneous mutation of PebAB-MX and PebAB-OX cells.
a. Cellular absorption spectra of wild-type S. elongatus (black dashed line), PebAB-MX (red dashed line) and PebAB-OX cultures (red solid line). The spectra were normalized at the Chl a absorbance at 678 nm. Abbreviation: Car, carotenoid. b. Photograph of the liquid cell cultures of wild-type S. elongatus, the PebAB-MX, and the PebAB-OX. c and d. Growth of wild-type S. elongatus (dashed line), the PebAB-MX (solid line with open circles) and the PebAB-OX (solid line with closed circles) under white light (c) and green light (d). Cells were illuminated with 40 μmol m−2 s−1 green-light or white-light LEDs. Values are represented as means ± SD with raw data from three independent experiments. Statistical significance for growth rate was determined by the one-way ANOVA and the Welch–Brown–Forthyse test, and significant differences are indicated with p values. e. Competition between PebAB-MX and wild-type cells under green light (green) or white light (white). Percentages of PebAB-MX cells in the mixture at the start of competition (day 0) or after 14 or 15 days of competition (day 14) are plotted. Values are represented as means ± SD. The results for five (green light) or four (white light) independent experiments are shown for each treatment. f. Spontaneous mutations in pebA and pebB genes in PebAB-OX cells that lack brown pigmentation. Seventy-four green colonies of PebAB-OX cells that lack brown pigmentation were analyzed. g. Percentage of brown colonies that yield PEB to all colonies under white light (black) and green light (green), plotted against OD730. Results with OD730 less than 1.0 are shown.
Extended Data Fig. 9
Extended Data Fig. 9. Maximum likelihood phylogeny of phycobilisome components.
Phylogenetic analyses include PebAB and PcyA (phycobilin biosynthesis), CpeAB and CpcAB (phycobiliprotein), CpeCDE and CpcC (rod linker), and CpeSTY and CpcEST (lyase).

Similar articles

References

    1. Sagan, C. Pale Blue Dot: A Vision of the Human Future in Space (Random House, 1994).
    1. Holland, H. D. The oxygenation of the atmosphere and oceans. Phil. Trans. R. Soc. B361, 903–915 (2006). - PMC - PubMed
    1. Payne, J. L. et al. The evolutionary consequences of oxygenic photosynthesis: a body size perspective. Photosynth. Res.107, 37–57 (2011). - PubMed
    1. Jabłońska, J. & Tawfik, D. S. The evolution of oxygen-utilizing enzymes suggests early biosphere oxygenation. Nat. Ecol. Evol.5, 442–448 (2021). - PubMed
    1. Green, B. R. What happened to the phycobilisome? Biomolecules9, 748 (2019). - PMC - PubMed

LinkOut - more resources