. 2025 Feb 18;8(1):110.
doi: 10.1038/s41746-025-01501-9.

Identification of digital twins to guide interpretable AI for diagnosis and prognosis in heart failure

Affiliations

Identification of digital twins to guide interpretable AI for diagnosis and prognosis in heart failure

Feng Gu et al. NPJ Digit Med. .

Abstract

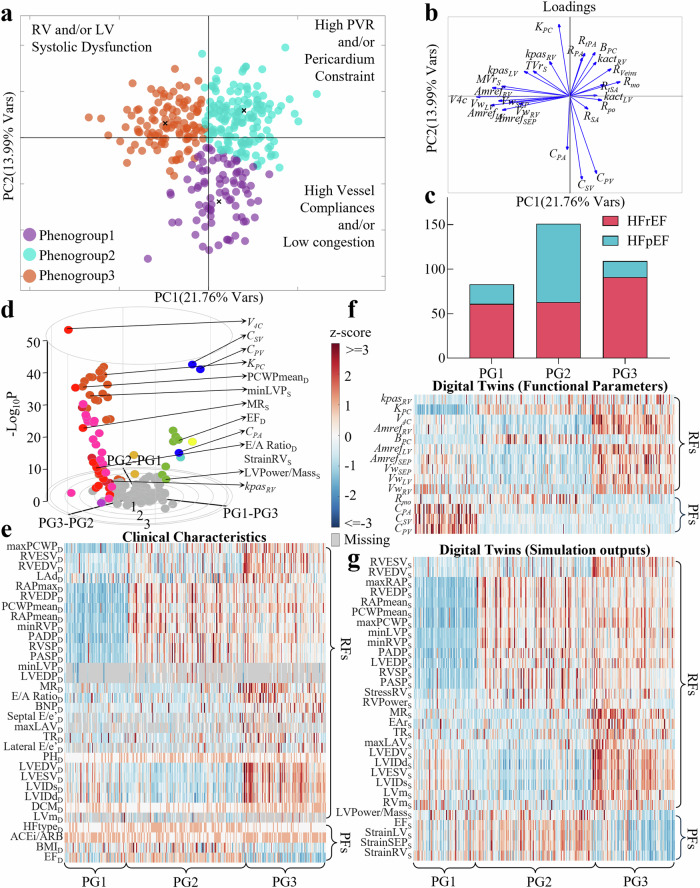
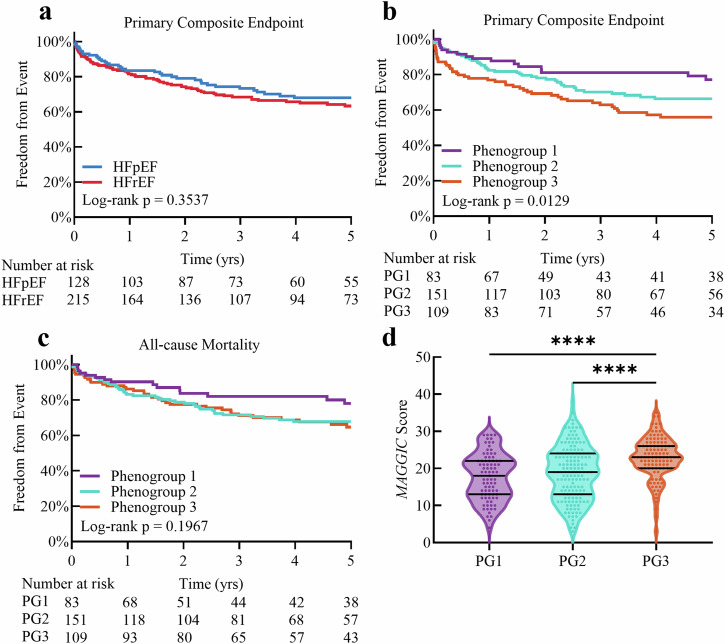
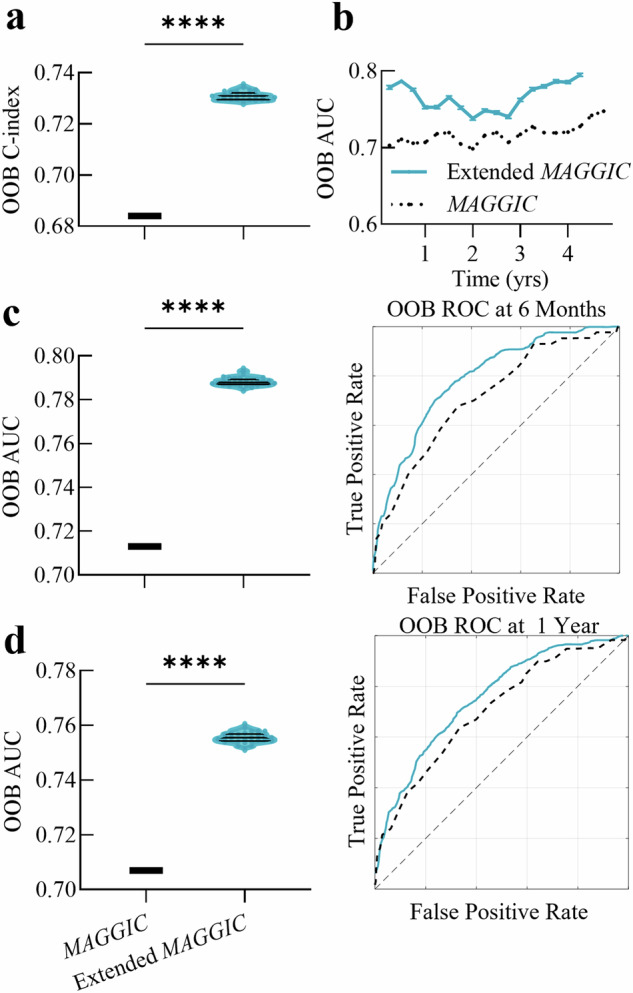
Heart failure (HF) is a highly heterogeneous condition, and current methods struggle to synthesize extensive clinical data for personalized care. Using data from 343 HF patients, we developed mechanistic computational models of the cardiovascular system to create digital twins. These twins, consisting of optimized measurable and unmeasurable parameters alongside simulations of cardiovascular function, provided comprehensive representations of individual disease states. Unsupervised machine learning applied to digital twin-derived features identified interpretable phenogroups and mechanistic drivers of cardiovascular death risk. Incorporating these features into prognostic AI models improved performance, transferability, and interpretability compared to models using only clinical variables. This framework demonstrates potential to enhance prognosis and guide therapy, paving the way for more precise, individualized HF management.


Conflict of interest statement

Competing interests: The authors declare no competing interests.

Figures

Fig. 1
Fig. 1. UMHS cohort discovery.
The flowchart represents the UMHS cohort discovery process. The extracted data are used for digital twin identification, precision phenotyping, and building prognostic AI models. RHC Right Heart Catheterization, TTE Transthoracic Echocardiography, CMR Cardiac Magnetic Resonance Imaging, CO Cardiac Output, HR Heart Rate, PADP Pulmonary Artery Diastolic Pressure, PASP Pulmonary Artery Systolic Pressure, PCWP Pulmonary Capillary Wedge Pressure, IVSd Interventricular Septum Thickness, LVPWd Left Ventricular Posterior Wall Thickness, LVEF Left Ventricular Ejection Fraction, LVIDd Left Ventricular Internal Diameter end-Diastole, LVIDs Left Ventricular Internal Diameter end-Systole, LAd Left Atrial Diameter, LVEDV Left Ventricular End-Diastolic Volume, LVESV Left Ventricular End-Systolic Volume, RVEDV Right Ventricular End-Diastolic Volume, RVESV Right Ventricular End-Systolic Volume, Qp/Qs ratio the ratio of pulmonary blood flow (Qp) to systemic blood flow (Qs), LVAD Left Ventricular Assist Device.
Fig. 2
Fig. 2. Digital twins identification.
a The modified TriSeg heart model is integrated with a lumped parameter model to simulate closed-loop hemodynamics. b Model-predicted short-axis heart geometry is illustrated for a representative HFrEF patient at three phases during one cardiac cycle. The color represents myofiber stress in the wall. c Key simulation outputs are compared to data for the same patient. Dashed lines represent measurements from RHC, TTE, and CMR, while solid lines represent the simulation outputs. d The table compares model outputs to clinical measurements for the example patient. Valve regurgitation degree is reported as a categorical variable in the TTE reports and as regurgitation fraction in the simulations. TriSeg three-wall segment, MV mitral valve, AV aortic valve. Other abbreviations are as previously defined at Fig. 1.
Fig. 3
Fig. 3. Distributions of model parameter values for HFrEF and HFpEF groups.
The data are presented as violin plots with medians and interquartile ranges. Parameter values are reported relative to control representations of baseline healthy male and female. Each dot represents an individual patient from the UMHS cohort, with red indicating HFrEF and blue indicating HFpEF. Functional parameters are organized as: heart mechanical properties (a), heart geometry (b), pericardium constraint (c), systemic circulation (d), and pulmonary circulation (e). *p < 0.05, **p < 0.01, ***p < 0.001, ****p < 0.0001.
Fig. 4
Fig. 4. Precision phenotyping of heart failure patients.
a Clustering results based on digital twins from UMHS cohort. Each dot represents a patient. b PCA loadings for PC1 and PC2. c Bar plot showing the distribution of diagnoses across phenogroups. d 3D volcano plot of clinical characteristics and digital twin features. Each dot represents a baseline feature. eg Heatmaps showing significant differences in clinical characteristics, functional parameters, and simulation outputs across phenogroups. Each row represents a baseline feature and each column represents a patient. PCA principal component analysis, PC principal component, PVR pulmonary vascular resistance, PG phenogroup, RF risk factor, PF protective factor. D features from clinical data, S features from simulation outputs.
Fig. 5
Fig. 5. Differences in prognostic outcomes across phenogroups.
a Kaplan-Meier plot for the primary composite endpoint in the UMHS cohort, stratified by diagnosis. Kaplan-Meier plot for the (b) primary composite endpoint and (c) all-cause mortality in the UMHS cohort, stratified by phenogroups. d Differences in MAGGIC scores across phenogroups. The primary composite endpoint includes all-cause mortality, LVAD implantation, and heart transplantation.
Fig. 6
Fig. 6. Digital twins improve prognostic AI performance.
The prognostic AI, referred to here as the RSF model, is trained using clinical characteristics, digital twins, and their combination from the UMHS cohort. The RSF model was evaluated using (a) OOB C-index and (b) time-dependent AUC. The time-dependent ROC curves and corresponding AUCs for (c) 6 months and (d) 1 year are shown. The AI's performance was also externally validated using the UW cohort, with evaluations based on (e) the C-index and (f) time-dependent AUC. Time-dependent ROC curves and corresponding AUCs for (g) 6 months and (h) 1 year are also displayed. Data are presented as violin plots or mean ± SD. RSF random survival forest, OOB out-of-bag, AUC area under the curve, ROC receiver operating characteristic, CC clinical characteristics, DT digital twins, C combination of CC and DT.
Fig. 7
Fig. 7. Extended MAGGIC score.
The Extended MAGGIC score combines the traditional MAGGIC score with additional features derived from digital twins. Differences in (a) the OOB C-index and (b) time-dependent AUC between the Extended MAGGIC score and the original MAGGIC score are illustrated. Time-dependent ROC curves at (c) 6 months and (d) 1 year, along with the corresponding AUCs, are also shown. Data are presented as violin plots or mean ± standard deviation from the UMHS cohort. Abbreviations are as defined above.
Fig. 8
Fig. 8. Overview of study workflow.
The figure provides a summary of the schematic workflow and key findings from this study. Mechanistic computational models of the cardiovascular system were used to create digital twins, enabling the estimation of individualized parameters and simulations. These digital twins informed unsupervised machine learning to identify interpretable phenogroups and mechanistic drivers of cardiovascular death risk. The integration of digital twin-derived features into prognostic AI models enhanced performance, transferability, and interpretability. This figure was generated using BioRender.com with permission under license agreement (Created in BioRender. Gu, F. & Schenk, N. (2025) https://BioRender.com/l38e240).

References

    1. McDonagh, T. A. et al. 2021 ESC Guidelines for the diagnosis and treatment of acute and chronic heart failure: Developed by the Task Force for the diagnosis and treatment of acute and chronic heart failure of the European Society of Cardiology (ESC) With the special contribution of the Heart Failure Association (HFA) of the ESC. Eur. Heart J.42, 3599–3726 (2021). - PubMed
    1. Beard, D. A., Hummel, S. L. & Jezek, F. Heart failure as a limitation of cardiac power output. Function3, zqab066 (2022). - PMC - PubMed
    1. Martin, S. S. et al. 2024 heart disease and stroke statistics: A report of us and global data from the american heart association. Circulation149, e347–e913 (2024). - PubMed
    1. Baxter, A. J. et al. β blockers in older persons with heart failure: tolerability and impact on quality of life. Heart88, 611–614 (2002). - PMC - PubMed
    1. Palau, P. et al. Effect of β-blocker withdrawal on functional capacity in heart failure and preserved ejection fraction. J. Am. Coll. Cardiol.78, 2042–2056 (2021). - PubMed

LinkOut - more resources