. 2025 Mar;7(3):617-630.
doi: 10.1038/s42255-025-01220-1. Epub 2025 Feb 18.

Metagenomic estimation of dietary intake from human stool

Affiliations

Metagenomic estimation of dietary intake from human stool

Christian Diener et al. Nat Metab. 2025 Mar.

Erratum in

Abstract

Dietary intake is tightly coupled to gut microbiota composition, human metabolism and the incidence of virtually all major chronic diseases. Dietary and nutrient intake are usually assessed using self-reporting methods, including dietary questionnaires and food records, which suffer from reporting biases and require strong compliance from study participants. Here, we present Metagenomic Estimation of Dietary Intake (MEDI): a method for quantifying food-derived DNA in human faecal metagenomes. We show that DNA-containing food components can be reliably detected in stool-derived metagenomic data, even when present at low abundances (more than ten reads). We show how MEDI dietary intake profiles can be converted into detailed metabolic representations of nutrient intake. MEDI identifies the onset of solid food consumption in infants, shows significant agreement with food frequency questionnaire responses in an adult population and shows agreement with food and nutrient intake in two controlled-feeding studies. Finally, we identify specific dietary features associated with metabolic syndrome in a large clinical cohort without dietary records, providing a proof-of-concept for detailed tracking of individual-specific, health-relevant dietary patterns without the need for questionnaires.


Conflict of interest statement

Competing interests: The authors report no financial or non-financial competing interests relevant to the work presented in this paper. S.M.G. received funding from a Global Grants for Gut Health Award from Nature Portfolio and Yakult. However, the funders were not involved in conducting the research, drafting the paper or reviewing the work.

Figures

Extended Data Fig. 1 ∣
Extended Data Fig. 1 ∣. MEDI benchmarks.
(a) Genomic distance (1 - ANI) vs. macronutrient distance (euclidean, in g/100 g). The blue line denotes a smooth spline regression and shaded area denotes the 95% confidence interval of the mean spline regression. (b) Benchmark of cached and batched processing using MEDI (6 CPUs per process, see Methods). 888 samples were divided into two batches of 500 and 388 FASTQ files and processes separately in parallel. Each point denotes a single FASTQ file and colors denote the batch. Vertical line denotes median classification rate. (c) Relationship between (haploid) genome/assembly size and food abundance in the iHMP data set. Shown are only genomes/assemblies with at least 1 million basepairs.
Extended Data Fig. 2 ∣
Extended Data Fig. 2 ∣. Foods and nutrients in controlled feeding studies.
(a) Food abundances in the MBD cohort by diet group (n = 30). Boxplots show 25%, 50%, and 75% quantiles.The center denotes the median and whiskers extend to the smallest and largest data points within 1.5 interquartile ranges. (b) Correlation between MEDI estimates and ground truth for varying fecal samples/food diary entry offsets. (c) MEDI predictions of total fiber content from fecal DNA (y-axis) and nutrient consumption of sugars, fibers and grains obtained from food diaries (x-axis) in a controlled-feeding study (PATH), where the dietary intake recorded in the daily food record precede the stool sample by at least 48 h. Each point denotes a single individual. For the food diaries, points represent means over all measured intake amounts and error bars denote the standard error of the mean (sd/sqrt(n)), normalized to a 100 g portion (all samples within the offset, 38 individuals with 124 food record diary entries). For the MEDI data, points x-coordinate represent point estimates of intake based on weighting nutrient profiles of food items by food item relative abundance and assuming a 100 g portion. Blue lines denote regression slopes and gray areas represent 95% confidence intervals. Annotations denote correlation coefficient (r) and p-value (p) from a Pearson product-moment correlation test.
Extended Data Fig. 3 ∣
Extended Data Fig. 3 ∣. Non-food reads in infant samples.
Relative abundance of bacterial and human reads across infant timeseries, colored by delivery route. Lines denotes a smooth spline regression and shaded areas denotes the 95% confidence interval of the spline regression.
Extended Data Fig. 4 ∣
Extended Data Fig. 4 ∣. MEDI dietary intake estimates were associated with metabolic health.
Abundances per 100 g portion for 1703 compounds across a cohort of 533 metabolically healthy and unhealthy individuals from the METACARDIS cohort. Fill colors denote abundance per standard portion (mg/100 g). Column annotations denote metabolic health status from the original METACARDIS cohort (HC - healthy cohort, MMC - IHD metabolically matched cohort, UMMC - untreated metabolically matched cohort). Here, MMC and UMMC denote disease-free but metabolically unhealthy groups. Row annotations denote the monomer mass of the compound (in g/mol).
Extended Data Fig. 5 ∣
Extended Data Fig. 5 ∣. Curation of FOODB data.
(a) Original content (x-axis) vs. energy content calculated by the Adwater method based on macronutrient content (Pearson r = 0.94, two-sided product-moment correlation test p < 2.2e-16). Colors denote detailed unique preparation types in the FOODB. (b) Cholesterol abundances across foods in the FOODB before adjustment.
Extended Data Fig. 6 ∣
Extended Data Fig. 6 ∣. Hibiscus associations.
Significant associations between food frequency questionnaires (FFQs) and Hibiscus genus abundance in the iHMP cohort (see Methods, n = 361). Associations were run for all 19 FFQ questions. Circles denote the mean and error bar denote standard deviation. p[lm] indicates the ANOVA p-value of a regression of log-transformed relative abundances and p[logit] denotes the p-value of a logistic regression of food occurrence against food frequency strata. Axis labels are common across all plots within this panel. Shown are only food groups with a Bonferroni-adjusted p(lm) < 0.05.
Fig. 1 ∣
Fig. 1 ∣. Constructing a metagenomic food database.
a, Illustration of the search strategy used to map food items to assemblies and their connection to nutrient content. b, Assembly size for the identified food-related organisms. Titles denote the database yielding the hit (GenBank, complete genomes; Nucleotide Database, partial assemblies). Boxplots show 25%, 50% and 75% quantiles; the centre denotes the median and whiskers extend to the smallest and largest data points within 1.5 interquartile ranges. c, Number of food organisms matched and the respective taxonomic rank where the match was found. d, Phylogenetic tree of the identified food organism assemblies, generated using UPGMA on estimated average nucleotide identity (estimated using MASH). Coloured circles denote the phylum, symbols indicate the dominant (that is, the most common, least-processed in FOODB) food preparation type, filled rectangles show macronutrient composition per 100 g of biomass and black bars show the energy content of individual food-assembly pairings per 100 g of biomass.
Fig. 2 ∣
Fig. 2 ∣. Food genome quantification on simulated ground-truth data.
a, Illustration of the mapping and filtering strategy used by MEDI. Individual k-mer assignments (LCA classifications) were used to assign consistency scores to reads and to filter reads with discordant mappings. b, Sampling strategy for the ground-truth data. All samples contain at least 90% background of an average bacteria, archaea and host background. Positive samples contain simulated reads from ten random food assemblies with exponentially increasing abundances. c, Quantification performance across simulated negative and positive controls. Points denoting a detected food item in a single sample are slightly jittered on the x axis to resolve overlaps. The black line denotes a linear regression fit (mean relationship between ground truth and observed) and the grey area is the 95% confidence interval around that mean. Fill colour denotes negative (red) or positive samples (blue). False-positive organisms are generally connected to organisms within the same taxonomic family. d, Probability of detecting a true-positive food item in a sample as a function of relative food item abundance (that is, detection power).
Fig. 3 ∣
Fig. 3 ∣. MEDI recapitulates data from controlled-feeding studies.
a, Outline and cohort sizes of the controlled-feeding studies used. b, Non-metric multidimensional scaling of MEDI food abundance beta diversity (Bray–Curtis distance) for the MBD study (n = 30, only samples with detected food (30 out of 34)). Individual lines connect each sample with the group centroid. Colours denote diet group (WD, Western diet; MBD, microbiome enhancer diet). Asterisks denote significance from a PERMANOVA (**P = 0.005). c, Relative abundance of foods (food reads / total reads) for all samples with detected foods in the MBD study (n = 30 metagenomes from n = 17 individuals, each subjected to both diets). Boxplots show 25%, 50% and 75% quantiles; the centre denotes the median and whiskers extend to the smallest and largest data points within 1.5 interquartile ranges. Asterisks denote significance under a two-sided Mann–Whitney U-test (***P = 0.0007). d, Volcano plot for differential abundance analysis of food abundances in the PATH study. Each point denotes a food species detected by MEDI. Red colour denotes food item with an FDR-adjusted P < 0.05 limma-voom regression of read counts vs intervention group (n = 48). e, MEDI predictions from faecal DNA (y axis) and nutrient consumption obtained from food diaries (x axis) in a controlled-feeding study (PATH), in which the dietary intake recorded in the daily food record precedes the stool sample by at least 48 h. Each point denotes a single individual. For the food diaries, points represent means over all measured intake amounts; error bars, s.e.m. (s.d. / sqrt(n)), normalized to a 100 g portion (all samples within the offset, 38 individuals with 124 food record diary entries). For the MEDI data, x-coordinate points represent estimates of intake based on weighting nutrient profiles of food items by food item relative abundance and assuming a 100 g portion. Blue lines denote regression slopes and grey areas represent 95% confidence intervals. Annotations denote correlation r and P value from a two-sided Pearson product-moment correlation test.
Fig. 4 ∣
Fig. 4 ∣. MEDI food abundances across infants and adults.
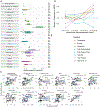
a, Fraction of samples with at least one detected food read across different age groups. b, Relative abundance of food-derived reads in a cohort of 447 infants. The blue line denotes the smoothing spline of the observed reads; the light blue area denotes the 95% confidence interval of the mean spline curve. Orange dots denote samples with less than 95% overall abundance mapped to bacteria (that is, low bacterial biomass). Grey shaded area denotes the interquartile area of the onset of solid food intake across infants. c, Energy content per standardized portion size (100 g) per sample in adults and infants. Shown are only samples with detected food items (n = 196 for infants and n = 359 for adults). Asterisk denotes significance under a Welch t-test: *P = 0.024. d, Macronutrient content per standardized portion size in infants and adults. Shown are only samples with detected food items (n = 196 for infants and n = 359 for adults). Asterisk denotes significance under a two-sided Welch t-test: *P = 0.015. In c and d, boxplots show 25%, 50% and 75% quantiles; the centre denotes the median and whiskers extend to the smallest and largest data points within 1.5 interquartile ranges. e, One-sided Mantel permutation test statistics for beta diversity agreement between MEDI-predicted food abundances, FFQs and microbial species abundances (Bray–Curtis distances; see Methods). Correlation between pairwise distance measures is indicated by r; Mantel test P value is shown. f, Comparison of relative food group abundances with paired diet frequency questionnaire data from infants. RPM, reads per million. Circles denote the mean; error bars, s.d. (n = 447). Pt-test indicates the P value of a two-sided Welch t-test of log-transformed relative abundances; Plogit denotes the P value of a logistic regression of food occurrence against food frequency strata. Axis labels are common across both plots in this panel. g, Comparison of MEDI-predicted relative food group abundances with diet frequency questionnaires in adults. Circles denote the mean; error bars, s.d. (only samples with paired FFQs, n = 361), Plm indicates the ANOVA P value of a regression of log-transformed relative abundances; Plogit denotes the P value of a logistic regression of food occurrence against food frequency strata. Axis labels are common across all plots in this panel.
Fig. 5 ∣
Fig. 5 ∣. MEDI dietary intake estimates were associated with metabolic health.
a, MEDI-detected food abundances across a cohort of 533 metabolically healthy and unhealthy individuals from the METACARDIS cohort. Fill colours denote abundance (log10(reads + 1)). Column annotations denote metabolic health status from the original METACARDIS cohort. Row annotations denote the major food groups from FOODB. b, Relationship between protein and carbohydrate abundances for all samples. Fill colour denotes energy content. c, Food-derived organisms with a significant association with metabolic health (FDR-corrected P < 0.05 in a limma-voom regression of read counts vs metabolic health status). Bars denote standard errors of the log2(fold change) (n = 533). Common food names are indicated below species. d, Food-derived phyla associated with metabolic health. FDR-corrected limma-voom P values are shown above. e, Food-derived compounds associated with metabolic health (FDR-corrected P < 0.05 in a linear regression of log abundance vs metabolic health status). Bars denote standard errors of log2(fold change) (n = 533). In c and e, positive log(fold changes) denote increased abundances in metabolically unhealthy individuals and negative log(fold changes) denote species more abundant in healthy individuals. Raw and corrected P values for c and e can be found in the Source data.

Update of

References

    1. Harding JE, Cormack BE, Alexander T, Alsweiler JM & Bloomfield FH Advances in nutrition of the newborn infant. Lancet 389, 1660–1668 (2017). - PubMed
    1. de Ridder D, Kroese F, Evers C, Adriaanse M & Gillebaart M Healthy diet: health impact, prevalence, correlates, and interventions. Psychol. Health 32, 907–941 (2017). - PubMed
    1. Clark M, Hill J & Tilman D The diet, health, and environment trilemma. Annu. Rev. Environ. Resour 43, 109–134 (2018).
    1. David LA et al. Diet rapidly and reproducibly alters the human gut microbiome. Nature 505, 559–563 (2014). - PMC - PubMed
    1. Wang DD et al. The gut microbiome modulates the protective association between a Mediterranean diet and cardiometabolic disease risk. Nat. Med 27, 333–343 (2021). - PMC - PubMed

LinkOut - more resources