. 2025 Feb 18;8(1):258.
doi: 10.1038/s42003-025-07713-9.

Functional compartmentalization of hepatic mitochondrial subpopulations during MASH progression

Affiliations

Functional compartmentalization of hepatic mitochondrial subpopulations during MASH progression

Noble Kumar Talari et al. Commun Biol. .

Abstract

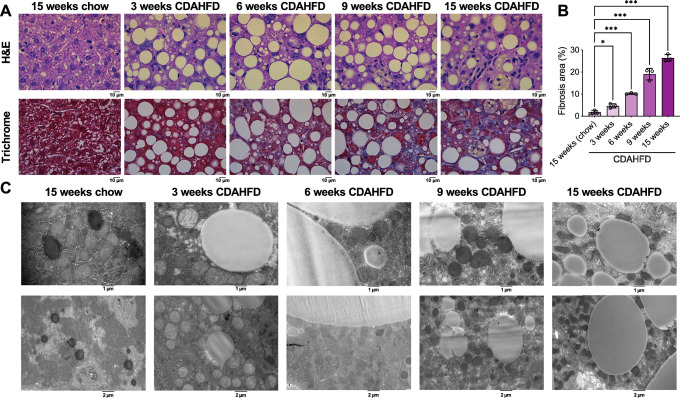
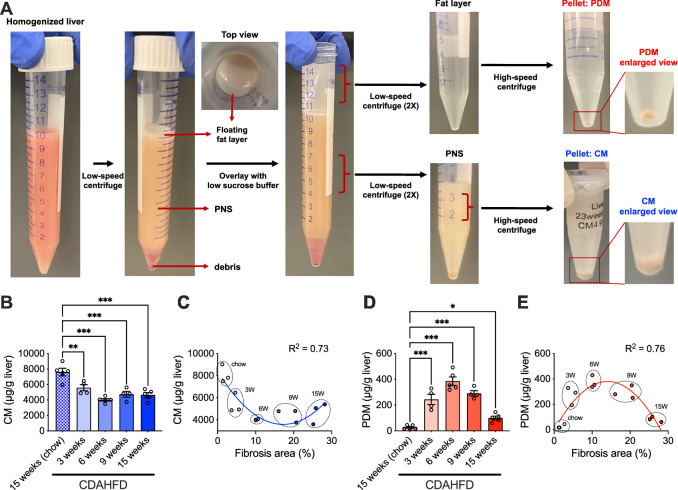
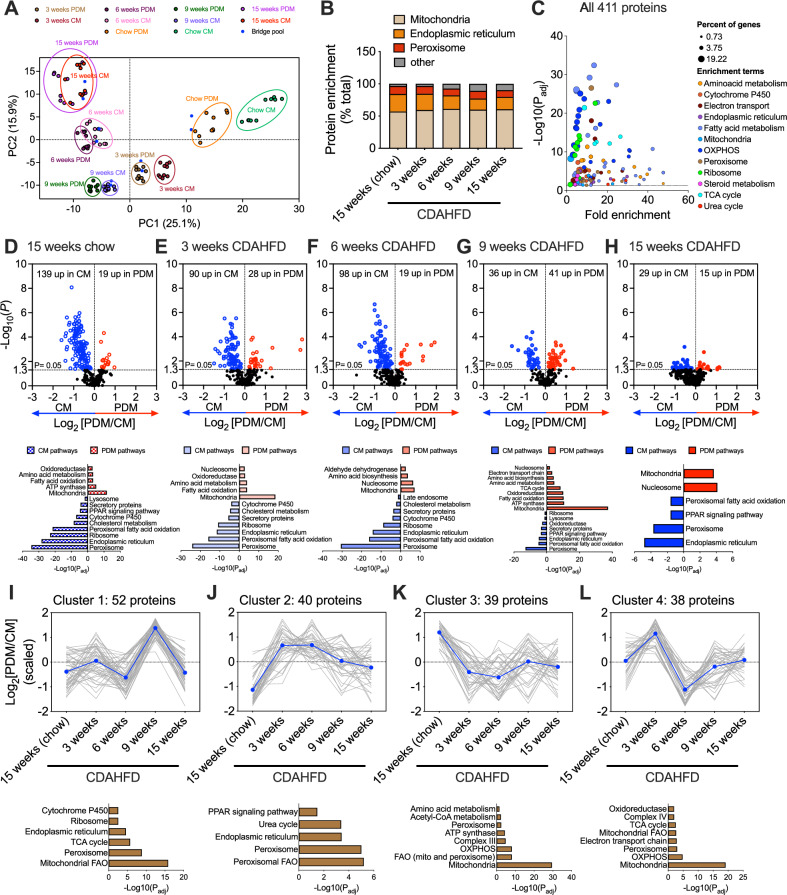
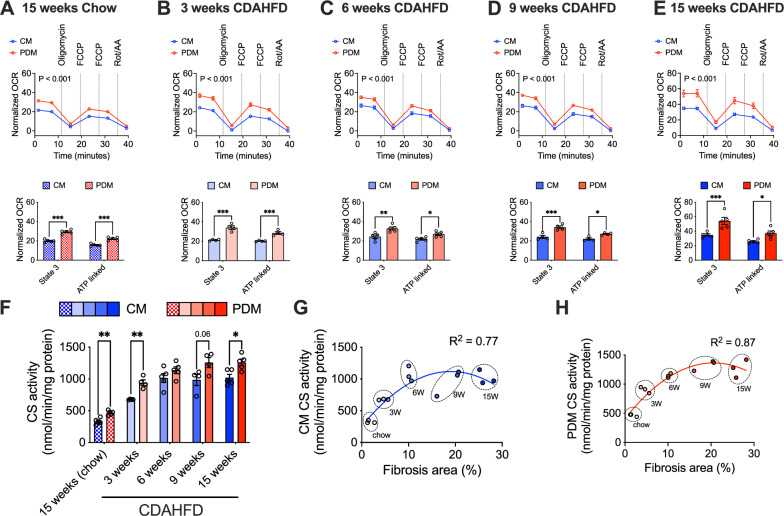
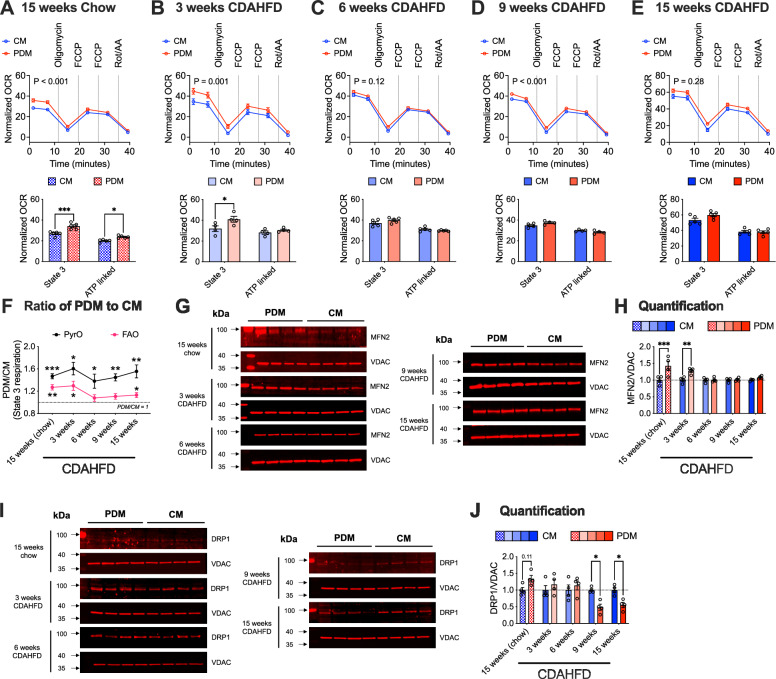
The role of peridroplet mitochondria (PDM) in diseased liver, such as during the progression of metabolic dysfunction-associated steatohepatitis (MASH), remains unknown. We isolated hepatic cytoplasmic mitochondria (CM) and PDM from a mouse model of diet-induced MASLD/MASH to characterize their functions from simple steatosis to advanced MASH, using chow-fed mice as controls. Our findings show an inverse relationship between hepatic CM and PDM levels from healthy to steatosis to advanced MASH. Proteomics analysis revealed these two mitochondrial populations are compositionally and functionally distinct. We found that hepatic PDM are more bioenergetically active than CM, with higher pyruvate oxidation capacity in both healthy and diseased liver. Higher respiration capacity of PDM was associated with elevated OXPHOS protein complexes and increased TCA cycle flux. In contrast, CM showed higher fatty acid oxidation capacity with MASH progression. Transmission electron microscopy revealed larger and elongated mitochondria during healthy and early steatosis, which appeared small and fragmented during MASH progression. These changes coincided with higher MFN2 protein levels in hepatic PDM and higher DRP1 protein levels in hepatic CM. These findings highlight the distinct roles of hepatic CM and PDM in MASLD progression towards MASH.


Conflict of interest statement

Competing interests: K.C.K., and U.M. have a patent pending for the method described herein. All other authors declare no conflict of interests.

Figures

Fig. 1
Fig. 1. Mitochondria dynamics and LD size varies by MASLD status.
A Representative H&E and trichrome images showing liver steatosis and fibrosis, B percent liver fibrosis area and C representative TEM images showing LD-mitochondrial contacts, CM and PDM, of livers harvested from healthy controls (i.e., 15 weeks Chow diet), early steatosis (i.e., 3 weeks CDAHFD), late steatosis (i.e., 6 weeks CDAHFD), early fibrosis (i.e., 9 weeks CDAHFD) and late fibrosis (i.e., 15 weeks CDAHFD) are shown. Percent fibrosis area is presented as mean ± SEM (n = 3 mice per group). P values were calculated by one-factor ANOVA with Holm-Sidak’s post hoc test. *P < 0.05; ***P < 0. 001.
Fig. 2
Fig. 2. Inverse relationship between hepatic CM and PDM levels during MASLD progression.
A Schematic representation of hepatic CM and PDM isolation from healthy, steatotic and/or fibrotic mouse liver. Low-speed centrifugation of homogenized liver revealed a thin floating fat layer (as opposed to a fat cake in adipose tissues), which was then separated by overlaying with low sucrose buffer. The fat layer was then used to isolate PDM, while the supernatant was used for CM isolation. Comparisons of B, C CM or D, E PDM levels across different MASLD stages and percent fibrosis area are shown. Non-linear regression was used to fit the curve and the R squared values are shown. Data are presented as mean ± SEM (n = 4–5 livers per group for different MASLD stages and 3 for percent fibrosis area). P values were calculated by one-factor ANOVA with Holm-Sidak’s post hoc test. *P < 0.05; **P < 0.01; ***P < 0. 001.
Fig. 3
Fig. 3. Hepatic CM and PDM have unique proteomes that is lost with MASH progression.
A PCA plot of proteomic data revealing distinct clusters between hepatic CM and PDM across healthy controls and different MASLD stages (n = 5 livers per group) are shown. DAVID B cellular compartment and C pathway enrichment analyses of the entire proteomic dataset are shown. Volcano plots showing significantly different proteomic changes and their respective DAVID enrichment analyses between hepatic CM and PDM isolated from D healthy controls, E early steatosis, F late steatosis, G early fibrosis and H late fibrosis are shown. IL Distinct clusters of proteins identified by k-means clustering analyses and their respective DAVID enrichment analyses are shown. P values were calculated by FDR for DAVID enrichment analyses; DH t test.
Fig. 4
Fig. 4. Hepatic PDM are specialized organelles for lipogenesis.
Respirometry traces of freshly isolated mitochondria driven by pyruvate and malate, and their respective State 3 and ATP-linked respiration from livers of A healthy controls, B early steatosis, C late steatosis, D early fibrosis and E late fibrosis are shown. F Quantification of CS activity between hepatic CM and PDM across healthy controls and different MASLD stages are shown. Comparisons of G CM or H PDM CS activity and percent fibrosis area are shown. Non-linear regression was used to fit the curve and the R squared values are shown. Data are presented as mean ± SEM (n = 4–5 livers per group for different MASLD stages and 3 for percent fibrosis area). P values were calculated by AE two-factor ANOVA with Holm-Sidak’s post hoc test; F multiple t tests. *P < 0.05; **P < 0.01.
Fig. 5
Fig. 5. Hepatic PDM have enhanced respiration capacity with elevated levels of OXPHOS proteins.
AE Respirometry traces of previously frozen mitochondria driven by succinate and rotenone for Complex II, and TMPD and ascorbate for Complex IV respiration, and follow-up (FJ) immunoblot analyses and their respective quantifications of OXPHOS complex subunits I-V from livers of A, F healthy controls, B, G) early steatosis, C, H late steatosis, D, I early fibrosis and E, J late fibrosis are shown. VDAC was used as a loading control. Data are presented as mean ± SEM (n = 4 livers per group). P values were calculated by AE two-factor ANOVA with Holm-Sidak’s post hoc test; FJ multiple t tests. *P < 0.05; **P < 0.01; ***P < 0. 001.
Fig. 6
Fig. 6. MASH progression compromises hepatic PDM’s FAO capacity, which corresponds to MFN2 protein levels.
Respirometry traces of freshly isolated mitochondria driven by palmitoyl-CoA, carnitine and malate, and their respective State 3 and ATP-linked respiration from livers of A healthy controls, B early steatosis, C late steatosis, D early fibrosis and E late fibrosis are shown. F Ratio of PDM to CM State 3 respiration fueled by pyruvate and malate (PyrO) or palmitoyl-CoA, carnitine, and malate (FAO) across healthy controls and different MASLD stages are shown. G, I Immunoblot analyses and their respective (H, J) quantifications of MFN2 and DRP1 protein levels across healthy controls and different MASLD stages are shown. VDAC was used as a loading control. Note: These images were derived from the same blots used to probe the OXPHOS proteins shown in Fig. 5 and, therefore, utilized the same VDAC loading control. Please refer to the uncropped and unedited blot/gel images in Supplementary Figs. 8–18 for further details. Data are presented as mean ± SEM (n = 4–5 livers per group). P values were calculated by (AE) two-factor ANOVA with Holm-Sidak’s post hoc test; F one sample t test against a hypothetical value of PDM/CM = 1; H, J multiple t tests. *P < 0.05; **P < 0.01; ***P < 0. 001.

References

    1. Rinella, M. E. et al. A multisociety Delphi consensus statement on new fatty liver disease nomenclature. Hepatology78, 1966–1986 (2023). - PMC - PubMed
    1. Eslam, M., Sanyal, A. J., George, J. & International Consensus, P. MAFLD: A Consensus-Driven Proposed Nomenclature for Metabolic Associated Fatty Liver Disease. Gastroenterology158, 1999–2014.e1991 (2020). - PubMed
    1. Adams, L. A. et al. The natural history of nonalcoholic fatty liver disease: a population-based cohort study. Gastroenterology129, 113–121 (2005). - PubMed
    1. Browning, J. D. et al. Prevalence of hepatic steatosis in an urban population in the United States: impact of ethnicity. Hepatology40, 1387–1395 (2004). - PubMed
    1. Kopec, K. L. & Burns, D. Nonalcoholic fatty liver disease: a review of the spectrum of disease, diagnosis, and therapy. Nutr. Clin. Pr.26, 565–576 (2011). - PubMed