. 2025 Apr;35(4):243-264.
doi: 10.1038/s41422-025-01075-x. Epub 2025 Feb 18.

A force-sensitive adhesion GPCR is required for equilibrioception

Affiliations

A force-sensitive adhesion GPCR is required for equilibrioception

Zhao Yang et al. Cell Res. 2025 Apr.

Abstract

Equilibrioception (sensing of balance) is essential for mammals to perceive and navigate the three-dimensional world. A rapid mechanoelectrical transduction (MET) response in vestibular hair cells is crucial for detecting position and motion. Here, we identify the G protein-coupled receptor (GPCR) LPHN2/ADGRL2, expressed on the apical membrane of utricular hair cells, as essential for maintaining normal balance. Loss of LPHN2 specifically in hair cells impaired both balance behavior and the MET response in mice. Functional analyses using hair-cell-specific Lphn2-knockout mice and an LPHN2-specific inhibitor suggest that LPHN2 regulates tip-link-independent MET currents at the apical surface of utricular hair cells. Mechanistic studies in a heterologous system show that LPHN2 converts force stimuli into increased open probability of transmembrane channel-like protein 1 (TMC1). LPHN2-mediated force sensation triggers glutamate release and calcium signaling in utricular hair cells. Importantly, reintroducing LPHN2 into the hair cells of Lphn2-deficient mice restores vestibular function and MET response. Our data reveal that a mechanosensitive GPCR is required for equilibrioception.


Conflict of interest statement

Competing interests: The authors declare no competing interests.

Figures
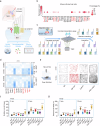
Fig. 1
Fig. 1. Screening of mechanosensitive aGPCRs in vestibular hair cells.
a Schematic representation of the potential roles of ion channels and GPCRs in MET process in vestibular hair cells. Enlarged box shows a tip link, composed of PCDH15 and CDH23, and putative components of the MET channel complex at the top of one stereocilium. b Expression profiles of 30 aGPCR genes in mouse utricular hair cells (data from GSE71982). The intensity of the circle color indicates the average mRNA expression level of the aGPCR in utricular hair cells. The size of the circle indicates the percentage of hair cells in which expression of the aGPCR was detected (aGPCR-expressing hair cell number/total hair cell number × 100%). The 12 aGPCRs expressed in more than 20% of the utricular hair cells are highlighted. c Schematic representation of the strategy used to screen mechanosensitive aGPCRs. d Summary of the force-induced Gi3 (top panel) and Gs (bottom panel) activation downstream of 12 aGPCRs. A force of 10 pN was applied to the receptors and the Gi3 or Gs activation was measured by BRET assay, which was presented as a heatmap (n = 3). e Schematic view (left panel) and representative tracks (right panel) of WT, Gpr133/, Lphn2+/ and Cib2/;Cib3/ mice in open-field tests during 2-min or 10-min tracking period. f, g Quantification of the circling (f) and traveling activity (g) of WT, Gpr133/, Gpr133+/, Atoh1-Cre+/−;Gpr126fl/fl (referred to as Ac-Gpr126flfl), Lphn2+/, Lphn3+/, Vlgr1/ and Cib2/;Cib3/ mice in open-field tests (n = 20 mice per group). Data are shown as means ± SEM. ***P < 0.001; ns no significant difference. Data were statistically analyzed using one-way ANOVA with Dunnett’s post hoc test.
Fig. 2
Fig. 2. LPHN2 is primarily expressed at the apical surface of utricular hair cells.
a Co-immunostaining of LPHN2 (green) with Myosin7a (red) in utricle wholemounts derived from WT mice at E18 or P40, or from Lphn2/ mouse embryos at E18 (n = 3 mice per group). Scale bars, 50 μm. b Representative images of wholemount RNAscope in situ hybridization of Lphn2 (white) combined with immunostaining of Myosin7a (red) in utricles of P40 mice (n = 3 mice). Arrows indicate Lphn2 staining in myosin7a-expressing hair cells. Scale bars, 50 μm and 10 μm for low- and high-magnification views, respectively. c Quantitative analysis of LPHN2 expression in myosin7a-positive utricular hair cells from WT mice or Lphn2/ embryos. Data are correlated to Fig. 2a, b (n = 3 mice per group). d Left panel: Diagram of utricular hair cells showing the selected optical planes (stereocilia, apical surface or basolateral section) for imaging by confocal microscopy. Middle panel: Co-immunostaining of LPHN2 (green) with spectrin (magenta) or phalloidin (gray) at different optical planes of hair cells in utricle wholemounts of P40 mice. Arrows indicate co-immunostaining of LPHN2 with spectrin. The line of polarity reversal (LPR) is depicted as a white dotted line. Scale bars, 10 μm. Right panel: Pearson’s correlation analysis of the fluorescence intensities of LPHN2 and spectrin at the apical surface of utricular hair cells was performed, revealing a correlation coefficient of 0.81. Data are correlated to Supplementary information, Fig. S5l, m. e Left panel: Schematic view of LPHN2 (red) expression in utricular hair cells. HC hair cells, SC supporting cells. Right panel: Expression of LPHN2-mCherry (red) with Myosin7a (green) or with SOX2 (magenta) in utricular sections derived from Lphn2mCherry mice at P40 (n = 3 mice per group). Arrows indicate the distribution of LPHN2-mCherry at the apical surface of utricular hair cells. The utricular hair cells and supporting cells are depicted by white and yellow dashed lines, respectively. Scale bars, 50 μm and 10 μm for low- and high-magnification views, respectively.
Fig. 3
Fig. 3. LPHN2-deficiency in mouse hair cells impairs balance.
a Schematic representation of the crossbreeding strategy to generate hair-cell-specific Lphn2-knockout mice and the time scales for vestibular functional analysis. The Pou4f3-CreER+/;Lphn2fl/fl mice (referred to as Pc-Lphn2fl/fl) or Pou4f3-CreER+/;Lphn2+/+ mice (referred to as Pc-Lphn2+/+) were treated with tamoxifen (75 mg/kg) dissolved in corn oil through round window membrane injection at P25 (left ear) and P26 (right ear) consecutively, and vestibular behavior tests were performed at P40. b Immunostaining of LPHN2 (magenta) and POU4F3 (green) in utricle wholemounts derived from Pc-Lphn2fl/fl or Pc-Lphn2+/+ mice (n = 3 mice per group). Enlarged images show the ablation of LPHN2 in the utricular hair cells of Pc-Lphn2fl/fl mice. Scale bars, 50 μm and 20 μm for low and high magnification views, respectively. cf Quantification of the swimming scores (c), time on the rotating rod (d), traveling activity (e) and circling activity (f) in the open field test of Pc-Lphn2fl/fl mice, Pc-Lphn2+/+ mice and Cib2/;Cib3/ mice (n = 13 mice per group). Data are shown as means ± SEM. ***P < 0.001. Data were statistically analyzed using one-way ANOVA with Dunnett’s post hoc test. g Representative recording curves (left panel) and quantification of the VOR gain values (right panel) of Pc-Lphn2fl/fl mice, Pc-Lphn2+/+ mice and Cib2/;Cib3/ mice in response to earth-vertical axis rotation (n = 13 mice per group). Data are shown as means ± SEM. *P < 0.05; **P < 0.01; ***P < 0.001; ns, no significant difference. Data were statistically analyzed using two-way ANOVA with Dunnett’s post hoc test. h Representative recording curves (left panel) and quantification of the VOR gain values (right panel) of Pc-Lphn2fl/fl mice, Pc-Lphn2+/+ mice and Cib2/;Cib3/ mice in response to off-vertical axis rotation (n = 13 mice per group). Data are shown as means ± SEM. ***P < 0.001. Data were statistically analyzed using one-way ANOVA with Dunnett’s post hoc test. ik Representative click-evoked VEMP waveforms (i), quantification of the P1–N1 peak amplitudes (j) and the P1 (filled triangle) and N1 (hollow triangle) peak latencies (k) of Pc-Lphn2fl/fl mice, Pc-Lphn2+/+ mice and Cib2/;Cib3/ mice at 100 dB nHL (n = 13 mice per group). Data are shown as means ± SEM. ***P < 0.001; ns, no significant difference. Data were statistically analyzed using one-way with Dunnett’s post hoc test.
Fig. 4
Fig. 4. LPHN2-deficiency does not affect the morphology of the mouse utricle.
a Immunostaining of Myosin7a (red) in utricular hair cells derived from Pc-Lphn2+/+ and Pc-Lphn2fl/fl mice at P40 (n = 8 mice per group). Scale bars, 50 μm. Three fields of 100 μm × 50 μm were defined and outlined in the lateral extrastriolar (LES) region, striolar region (S) and medial extrastriolar (MES) region. b Quantification of the size of utricles (left panel) and hair cell density at different regions of utricles (right panel) derived from Pc-Lphn2+/+ and Pc-Lphn2fl/fl mice (n = 8 mice per group). Data are correlated to Fig. 4a. Data are shown as means ± SEM. ns no significant difference. Data were statistically analyzed using unpaired two-sided Student’s t-test. c Immunostaining of kinocilium (labeled with α-tubulin, green) and stereocilia (labeled with phalloidin, magenta) in utricle wholemounts derived from Pc-Lphn2+/+ and Pc-Lphn2fl/fl mice (n = 3 mice per group). Scale bars, 5 μm. d Quantification of the length of kinocilium (left panel) and the ratio of lengths of the kinocilium to tallest stereocilia (right panel) in ES or S region of utricle wholemounts derived from Pc-Lphn2+/+ and Pc-Lphn2fl/fl mice (n = 24 hair cells from 3 mice per group). Data are correlated to Fig. 4c. Data are shown as means ± SEM. ns no significant difference. Data were statistically analyzed using unpaired two-sided Student’s t-test. e Co-immunostaining of phalloidin (green) and different MET machinery components (magenta), including TMC1, TMC2, CDH23, PCDH15, LHFPL5 and TMIE, in utricular hair cells derived from Pc-Lphn2+/+ and Pc-Lphn2fl/fl mice (n = 6 mice per group). Scale bar, 5 μm. Data are correlated to Supplementary information, Fig. S6g, h.
Fig. 5
Fig. 5. LPHN2-deficiency impairs MET currents in utricular hair cells.
a Schematic illustration of the labeling of LPHN2-expressing utricular hair cells by AAV-ie-Lphn2pr-mCherry (referred to as AAV-ie-L2pr-mCherry) and the MET current recording by fluid-jet stimulation. The Cre recombinase was activated in Pou4f3-CreER+/ mouse embryos by treating the pregnant mice at E14 with 100 mg/kg tamoxifen supplemented with 37.5 mg/kg progesterone for 3 consecutive days through intraperitoneal injection. AAV-ie-Lphn2pr-mCherry was injected into P3 mice through round window membrane, and the mCherry-labeled utricular hair cells at P10 were selected for MET current recording. b Representative MET current traces induced by sinusoidal fluid jet stimulation in utricular hair cells of Pc-Lphn2+/+ mice (black) or Pc-Lphn2fl/fl mice (red) at P10. c Quantification of the peak MET currents in utricular hair cells of Pc-Lphn2+/+ mice or Pc-Lphn2fl/fl mice at P10 (n = 14). Data are correlated to Fig. 5b. Data are shown as means ± SEM. ***P < 0.001. Data were statistically analyzed using unpaired two-sided Student’s t-test. d, e Representative current traces (d) and quantitative analysis (e) of fluid-jet-stimulated MET responses in utricular hair cells derived from Pc-Lphn2+/+, Pc-Lphn2fl/fl or Tmc1/;Tmc2+/−mice in the absence (black) or presence (red) of 50 nM D11. Data are normalized to the peak MET current of control vehicle-treated hair cells in respective groups (n = 14, 9 and 8 for Pc-Lphn2+/+, Pc-Lphn2fl/fl and Tmc1/;Tmc2+/−, respectively). Data are correlated to Supplementary information, Fig. S7e. Data are shown as means ± SEM. ***P < 0.001; ns, no significant difference. Data were statistically analyzed using paired two-sided Student’s t-test.
Fig. 6
Fig. 6. LPHN2 regulates the MET current at the apical surface of utricular hair cells.
a Schematic illustration showing fluid-jet-stimulated MET responses in utricular hair cells before and after treatment with BAPTA, which disrupts the tip links. b Representative MET current traces induced by sinusoidal fluid jet stimulation in cochlear outer hair cells (OHCs) (left panel) or utricular hair cells (right panel) before and after treatment with BAPTA for 5 min (n = 8 per group). The normal-polarity and reverse-polarity MET current traces are colored blue and pink, respectively. The fluid-jet-stimulated cochlear or utricular hair cells are outlined in green. c Quantification of the normal-polarity (outward phase, blue) or reverse-polarity (inward phase, pink) MET current of cochlear (top) or utricular hair cells (bottom) in response to fluid jet stimulation (n = 8 per group). Data are shown as means ± SEM. ***P < 0.001. Data were statistically analyzed using paired two-sided Student’s t-test. d, e Representative current traces (d) and quantitative analysis (e) of fluid-jet-stimulated MET responses in BAPTA-treated utricular hair cells derived from Pc-Lphn2+/+ or Pc-Lphn2fl/fl mice in the absence or presence of 50 nM D11 (n = 10 and 7 for Pc-Lphn2+/+ and Pc-Lphn2fl/fl mice, respectively). Data are shown as means ± SEM. ***P < 0.001; ns no significant difference. Data were statistically analyzed using paired two-sided Student’s t-test. f, g Representative current traces (f) and quantitative analysis (g) of fluid-jet-stimulated MET responses in BAPTA-treated WT utricular hair cells in the absence or presence of 1 μM C14 (n = 5). Data are shown as means ± SEM. **P < 0.01; ns no significant difference. Data were statistically analyzed using paired two-sided Student’s t-test.
Fig. 7
Fig. 7. LPHN2 colocalizes with TMC1 at the apical surface of utricular hair cells and regulates MET through coupling to TMC1.
a Co-immunoprecipitation of LPHN2 with TMC1 in the lysates of mouse utricles. Representative blots from three independent experiments are shown (n = 3). b Co-immunostaining of TMC1 (magenta) with LGR6 (green) in HEK293 cells transfected with TMC1 only or with TMC1 and LGR6. Scale bars, 10 μm. Representative images from three independent experiments are shown (n = 3). c Co-immunostaining of LGR6 (green) with LPHN2 (magenta) or with TMC1 (red) at the apical surface of utricular hair cells. Scale bars, 2 μm. Representative images from three independent experiments are shown (n = 3). d Representative spontaneous single-channel currents of TMC1 at –40 mV recorded in HEK293 cells co-transfected with LPHN2/TMC1, LPHN2/LGR6, TMC1/LGR6 or LPHN2/TMC1/LGR6. Representative current traces from three independent experiments are shown (n = 3). e The normalized all-point amplitude histogram analysis of single-channel currents in HEK293 cells transfected with TMC1/LGR6. The distribution data were fitted by a sum of two Gaussians, and the peaks correspond to the closed (C) and open (O) states. The histogram is correlated with the current trace in Fig. 7d and represents a time window of 5 s. f The current-voltage (I-V) relationship of the spontaneous currents recorded in HEK293 cells transfected with TMC1/LGR6 (n = 3). g, h Representative traces (g) and quantitative analysis (h) of the spontaneous single-channel currents at –40 mV recorded in HEK293 cells transfected with LGR6 and TMC1 (WT or mutants) (n = 3). Data are shown as means ± SEM. ***P < 0.001. Data were statistically analyzed using one-way ANOVA with Dunnett’s post hoc test. i Representative current traces (left panel) and histogram analysis (right panel) of the single-channel currents recorded in HEK293 cells transfected with LPHN2/TMC1/LGR6 under control condition (black) or in response to 10 pN force stimulation applied through LPHN2-M-beads (red). j, k Representative traces (j) and summarization of the channel open probability (k) of the single-channel currents recorded in HEK293 cells transfected with LPHN2/TMC1/LGR6 in response to varying force amplitudes (1 pN, 10 pN and 30 pN) applied through LPHN2-M-beads in the absence or presence of 50 nM D11 (n = 3). Data are shown as means ± SEM. *P < 0.05; ***P < 0.001. Data were statistically analyzed using paired two-sided Student’s t-test.
Fig. 8
Fig. 8. Force sensation by LPHN2 induces glutamate release and Ca2+ signals in utricular hair cells.
a Schematic diagram showing the detection of fluid-jet-stimulated glutamate release in utricular hair cells by a glutamate reporter Rncp-iGluSnFR. b, c Representative traces (b) and quantitative analysis (c) of fluid-jet-stimulated glutamate secretion from utricular hair cells derived from Pc-Lphn2+/+ mice (black) or Pc-Lphn2fl/fl mice (red) at P10 (n = 8). The magnitude of the glutamate secretion was characterized by ΔF/F0. Data are shown as means ± SEM. ***P < 0.001. Data were statistically analyzed using unpaired two-sided Student’s t-test. d Schematic diagram showing the detection of glutamate release in mouse utricular hair cells in response to force stimulation applied through magnetic beads. e, f Representative traces (e) and quantitative analysis (f) of glutamate secretion from individual utricular hair cell derived from P10 Pc-Lphn2+/+ mice (n = 12) or Pc-Lphn2fl/fl mice (n = 10) in response to force applied through LPHN2-M-beads or control beads. Data are correlated to Supplementary information, Fig. S10c. Data are shown as means ± SEM. ***P < 0.001; ns no significant difference. Data were statistically analyzed using unpaired two-sided Student’s t-test. g Schematic diagram showing the detection of fluid-jet-stimulated Ca2+ response in utricular hair cells. h, i Representative traces (h) and quantitative analysis (i) of fluid-jet-stimulated Ca2+ signals in utricular hair cells derived from Pc-Lphn2+/+ mice (black) or Pc-Lphn2fl/fl mice (red) at P10 (n = 6). The magnitude of the Ca2+ response was characterized by ΔF/F0. Data are shown as means ± SEM. ***P < 0.001. Data were statistically analyzed using unpaired two-sided Student’s t-test. j Schematic diagram showing the detection of Ca2+ signals in mouse utricular hair cells in response to force stimulation applied through magnetic beads. k Heatmaps showing the Ca2+ responses in individual utricular hair cells derived from Pc-Lphn2+/+ or Pc-Lphn2fl/fl mice. n = 80, 20 and 20 for mCherry-labeled Pc-Lphn2+/+ cells (red box), mCherry-unlabeled Pc-Lphn2+/+ cells (orange box), and mCherry-labeled Pc-Lphn2fl/fl cells (blue box), respectively. The color intensity indicates the magnitude of the calcium response characterized by ΔF/F0.
Fig. 9
Fig. 9. Re-expression of LPHN2 specifically in hair cells rescues vestibular function of LPHN2-deficient mice.
ad Quantification of the circling (a) and traveling activity (b) in the open-field test, swimming scores (c) and duration time on the rotating rod (d) of Pc-Lphn2+/+, Pc-Lphn2fl/fl, AAV-ie-LPHN2 mice and AAV-ie-Lphn2pr mice (n = 6 mice per group). Data are shown as means ± SEM. **P < 0.01; ***P < 0.001; ns no significant difference. Data were statistically analyzed using one-way ANOVA with Dunnett’s post hoc test. e, f Representative recording curves (left panels) and quantification of the VOR gain responses (right panels) of Pc-Lphn2+/+, Pc-Lphn2fl/fl, AAV-ie-LPHN2 mice and AAV-ie-Lphn2pr mice to earth-vertical axis (e) or off-vertical axis (f) rotation (n = 6 mice per group). Data are shown as means ± SEM. *P < 0.05; **P < 0.01; ***P < 0.001; ns no significant difference. Data were statistically analyzed using one-way ANOVA with Dunnett’s post hoc test. g, h Representative current traces (g) and quantitative analysis (h) of fluid-jet-stimulated MET responses in BAPTA-treated utricular hair cells derived from Pc-Lphn2+/+, AAV-ie-LPHN2 or AAV-ie-Lphn2pr mice in the absence or presence of 50 nM D11 (n = 5, 5 and 6 for Pc-Lphn2+/+, AAV-ie-LPHN2 or AAV-ie-Lphn2pr mice, respectively). Data are shown as means ± SEM. **P < 0.01; ns no significant difference. Data were statistically analyzed using paired two-sided Student’s t-test.

References

    1. Cullen, K. E. Vestibular processing during natural self-motion: implications for perception and action. Nat. Rev. Neurosci.20, 346–363 (2019). - PMC - PubMed
    1. Eatock, R. A. & Songer, J. E. Vestibular hair cells and afferents: two channels for head motion signals. Annu. Rev. Neurosci.34, 501–534 (2011). - PubMed
    1. Hudspeth, A. J. The cellular basis of hearing: the biophysics of hair cells. Science230, 745–752 (1985). - PubMed
    1. Douguet, D. & Honore, E. Mammalian mechanoelectrical transduction: Structure and function of force-gated ion channels. Cell179, 340–354 (2019). - PubMed
    1. Basu, A., Lagier, S., Vologodskaia, M., Fabella, B. A. & Hudspeth, A. J. Direct mechanical stimulation of tip links in hair cells through DNA tethers. Elife5, e16041 (2016). - PMC - PubMed

LinkOut - more resources