. 2025 Mar;57(3):694-705.
doi: 10.1038/s41588-025-02086-5. Epub 2025 Feb 18.

ImmuneLENS characterizes systemic immune dysregulation in aging and cancer

Collaborators, Affiliations

ImmuneLENS characterizes systemic immune dysregulation in aging and cancer

Robert Bentham et al. Nat Genet. 2025 Mar.

Abstract

Recognition and elimination of pathogens and cancer cells depend on the adaptive immune system. Thus, accurate quantification of immune subsets is vital for precision medicine. We present immune lymphocyte estimation from nucleotide sequencing (ImmuneLENS), which estimates T cell and B cell fractions, class switching and clonotype diversity from whole-genome sequencing data at depths as low as 5× coverage. By applying ImmuneLENS to the 100,000 Genomes Project, we identify genes enriched with somatic mutations in T cell-rich tumors, significant sex-based differences in circulating T cell fraction and demonstrated that the circulating T cell fraction in patients with cancer is significantly lower than in healthy individuals. Low circulating B cell fraction was linked to increased cancer incidence. Finally, circulating T cell abundance was more prognostic of 5-year cancer survival than infiltrating T cells.


Conflict of interest statement

Competing interests: N.M. and R.B. hold a European patent for determination of B cell fraction in mixed samples (PCT/EP2024/062999). N.M., R.B., T.B.K.W. and C.S. hold a European patent for determination of lymphocyte abundance in mixed samples (PCT/EP2022/070694). N.M. has stock options in and has consulted for Achilles Therapeutics and holds a European patent relating to targeting neoantigens (PCT/EP2016/059401), identifying patient response to immune checkpoint blockade (PCT/EP2016/071471), determining HLA LOH (PCT/GB2018/052004) and predicting survival rates of patients with cancer (PCT/GB2020/050221). C.S. acknowledges grant support from AstraZeneca, Boehringer-Ingelheim, Bristol Myers Squibb, Pfizer, Roche-Ventana, Invitae (previously Archer Dx Inc - collaboration in minimal residual disease sequencing technologies), Ono Pharmaceutical and Personalis. He is chief investigator for the AZ MeRmaiD 1 and 2 clinical trials and is the steering committee chair. He is also co-chief investigator of the NHS Galleri trial funded by GRAIL and a paid member of GRAIL’s scientific advisory board (SAB). He receives consultant fees from Achilles Therapeutics (also SAB member), Bicycle Therapeutics (SAB member, and chair of clinical advisory group), Genentech, Medicxi, China Innovation Centre of Roche (CICoR) (formerly Roche Innovation Centre – Shanghai, Metabomed (until July 2022)), Relay Therapeutics (SAB member), Saga Diagnostics (SAB member), and the Sarah Cannon Research Institute. C.S. has received honoraria from Amgen, AstraZeneca, Bristol Myers Squibb, GlaxoSmithKline, Illumina, MSD, Novartis, Pfizer and Roche-Ventana. C.S. has previously held stock/options in GRAIL, and currently has stock/options Bicycle Therapeutics, Relay Therapeutics, and has stock and is co-founder of Achilles Therapeutics. C.S. declares a patent application for methods to lung cancer (PCT/US2017/028013); targeting neoantigens (PCT/EP2016/059401); identifying patent response to immune checkpoint blockade (PCT/EP2016/071471); methods for lung cancer detection (US20190106751A1); identifying patients who respond to cancer treatment (PCT/GB2018/051912); determining HLA LOH (PCT/GB2018/052004); predicting survival rates of patients with cancer (PCT/GB2020/050221), methods and systems for tumour monitoring (PCT/EP2022/077987), Analysis of HLA alleles transcriptional deregulation (PCT/EP2023/059039). C.S. is an inventor on a European patent application (PCT/GB2017/053289) relating to assay technology to detect tumour recurrence. This patent has been licensed to a commercial entity and under their terms of employment C.S is due a revenue share of any revenue generated from such license(s). The remaining authors declare no competing interests.

Figures

Fig. 1
Fig. 1. Overview of ImmuneLENS and validation.
a, Overview of the ImmuneLENS method. The figure is created with BioRender.com. b, Scatter plot of TCRA T cell fractions calculated from TRACERx WGS versus WES data. The red dotted line represents y = x; the blue line shows the line of best fit with a light blue-shaded 95% confidence interval (CI). c, Scatter plots comparing ImmuneLENS fractions from TRACERx100 WGS and TCRA T cell fractions from T cell ExTRECT (TRACERx100 WES data) against T cell- and B cell-related Danaher scores from matched RNA-seq samples. The blue line represents the line of best fit with a light blue-shaded 95% CI. d, Correlation of TCRA T cell fraction, IGH B cell fraction and T/B cell ratio with date-matched blood count data (lymphocyte count, neutrophil count and NLR values) within the 100KGP cohort. The blue line represents the line of best fit with a light blue-shaded 95% CI. P values for Spearman’s ρ were derived from a two-tailed t distribution using the correlation coefficient and sample size. CNA, copy number alteration; CS, class switching; RDR, read depth ratio.
Fig. 2
Fig. 2. ImmuneLENS applied to 100KGP.
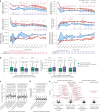
The number of tumor samples per cancer histology is given above the plot. The panels represent snake plots for circulating and infiltrating TCRA T cell fractions and IGH B cell fractions, with each point representing a single blood or tumor sample. Above each IGH B cell fraction snake plot is a track, shown as a heatmap, displaying the proportion of different Ig B cells for each sample. Histology groups are arranged in ascending order based on the median circulating TCRA T cell fraction, and within each group, samples are sorted from lowest to highest value in each snake plot. Right, snake plots for the circulating T cell and B cell fractions within the 100KGP healthy cohort. No significant differences were identified (using ANOVA) in the proportions of B cell Ig status among cancer histology groups in either circulating or infiltrating samples. Horizontal red lines represent the median value per histology group. GI, gastrointestinal.
Fig. 3
Fig. 3. Disruption of circulating T cell fraction in patients with cancer.
a, Ribbon plots of ImmuneLENS-related fractions in 5-year age brackets, split by the healthy control and cancer cohorts. The width of bands represents the extent of sexual dimorphism between male and female individuals, with significance assessed by two-sided Wilcoxon rank-sum tests within each age group and adjusted P values with effect size (ES) values shown. b, Boxplots of IgM/IgD and Ig class-switched B cell fractions from a subset of the healthy cohort with recorded cancer incidence post-WGS sequencing (from hospital episode statistics), compared to an age- and sex-matched propensity cohort of the same size. c, Boxplots of blood TCRA T cell fraction versus genetically inferred ancestry in the 100KGP healthy and cancer cohorts. d, Boxplots for tumor TCRA T cell fraction versus genetically inferred ancestry in the 100KGP cancer cohort. e, Volcano plots of known GWAS SNP associations with circulating TCRA T cell fraction. Multiple hypothesis adjustments were performed using the Benjamini–Hochberg method. Boxplots in bd show the median and lower and upper quartiles, with whiskers extending to 1.5× interquartile range. Two-sided Wilcoxon rank-sum tests were used to assess the significance between groups in bd. The P values in e are derived from PLINK software, which uses a linear regression model and performs a Wald test for each SNP. For the cancer cohort, this was done separately for each histology, and P values were combined using a meta-analysis with a common effects model.
Fig. 4
Fig. 4. Association of selection with infiltrating T cell fraction.
a, Volcano plot showing results from a Poisson model predicting observed nonsynonymous mutations as a function of TCRA T cell fraction and other covariates (age, tumor mutation burden, sex and disease type). The plot shows the estimates and −log10(P) for the TCRA variable, highlighting genes where observed mutations significantly depend on T cell immune infiltration (hot tumors denote high levels of immune cell infiltration; cold tumors lack immune cell infiltration). Point size represents the number of patients in the cancer cohort with nonsynonymous mutations, excluding patients with hematological cancers. Genes tested were limited to known cancer drivers from the Cancer Gene Census. b, Bubble plot showing the significance of TCRA infiltrating T cell fraction within a Poisson model applied to individual cancer types. In both plots (a,b), P values represent the significance of the TCRA T cell fraction term in the Poisson model and are calculated using a Wald test.
Fig. 5
Fig. 5. Prognostic value of ImmuneLENS lymphocyte fractions in 100KGP.
a, Five-year survival Kaplan–Meier plots for the entire pan-cancer 100KGP cohort, stratified into high and low groups based on the median circulating or infiltrating TCRA T cell fractions and IGH B cell fractions. b, Results from CoxPH models for 13,872 participants within the 100KGP pan-cancer cohort with complete clinical annotation. The models account for the effects of age, sex, genetically inferred ancestry, pretreatment chemotherapy and cancer stage. Left, pan-cancer HRs with 95% CIs. Right, a heatmap of HRs for different cancer histologies, including the I2 score from a meta-analysis using a random effects model across all histologies. Significance was calculated using Cochran’s Q test. Multiple hypothesis adjustments were performed using the Benjamini–Hochberg method, applied by row. Individual P values were calculated using a two-sided Wald test within the Cox model. *P < 0.05, **P < 0.01 and ***P < 0.001.
Extended Data Fig. 1
Extended Data Fig. 1. Validation and description of ImmuneLENS.
a, Diagram illustrating possible class-switching deletion events following VDJ recombination at the IGH locus, resulting in B cells producing different antibodies. b, Example ImmuneLENS output showing the TCRA locus for TRACERx sample CRUK0085 region 3. The log read depth ratio plot corresponds to a predicted T cell fraction of 0.14. Alternating colors represent changes in the 14 TRAV segments selected by the model, which are also depicted in the bubble plot (right). c, Example ImmuneLENS output showing the IGH locus for TRACERx sample CRUK0004 region 2, with a predicted B cell fraction of 0.25. IGHV segment usage and class-switching percentages are also displayed (right). d, Scatter plots showing the correlation between T cell fraction values calculated by ImmuneLENS from the TCRA, TCRB or TCRG loci. The blue line represents the line of best fit, and the gray region indicates the 95% confidence interval. e, Heatmap of ImmuneLENS’ fractions compared to RNA-seq signatures for different cell types. f, Differential gene expression analysis (bottom) of TRACERx RNA-seq samples split into high and low groups based on median predicted non-class-switched IgM/IgD B cell fractions and class-switched IgA and IgG B cell fractions. Analysis and significance were assessed using limma–voom (Methods), accounting for multiple hypothesis testing. Red points represent genes within the Travaglini lung B cell gene signature. P values were derived from a GSEA analysis (top) of all cell type signature genesets defined by MSigDB, with P-value estimation based on an adaptive multi-level split Monte Carlo scheme. The P values for Spearman’s ρ in d were derived from a two-tailed t-distribution using the correlation coefficient and sample size.
Extended Data Fig. 2
Extended Data Fig. 2. Nested downsampling of TRACERx data.
a, Correlation of T cell fraction at 60× coverage with samples downsampled to different coverage levels using nested downsampling. b, Example ImmuneLENS model outputs of the same sample at different downsampled coverage depths. c,d. Correlation of TCRB and TCRG T cell fractions at 60× coverage with samples downsampled to different coverage levels using nested downsampling. e, Correlation of circulating B cell fraction at 30× coverage with samples downsampled to different coverage levels using nested downsampling. Top: B cell fraction calculated without IGH haplotype correction. Bottom: B cell fraction calculated with IGH haplotype correction f, Correlation of infiltrating B cell fraction at 30× coverage with samples downsampled to different coverage levels using nested downsampling. Top: B cell fraction calculated without IGH haplotype correction. Middle: B cell fraction calculated with germline IGH haplotype correction. Bottom: B cell fraction calculated with both germline and somatic IGH haplotype correction. Throughout, blue lines represent the line of best fit, and gray regions indicate the 95% confidence interval. The P values for Pearson’s R were derived from a two-tailed t-distribution using the correlation coefficient and sample size.
Extended Data Fig. 3
Extended Data Fig. 3. Association of ImmuneLENS scores with blood count data.
a. ImmuneLENS fractions versus date-matched blood count data for albumin, C-reactive protein, ferritin, platelets and white blood count. Blue lines represent the line of best fit with gray regions representing 95% confidence interval. P values for Spearman’s ρ were derived from a two-tailed t-distribution using the correlation coefficient and sample size.
Extended Data Fig. 4
Extended Data Fig. 4. Validation of TCR diversity metrics.
a, Cartoon overview of the use of ImmuneLENS to calculate Shannon diversity values from TRAV segment usage as well as divergence metrics between two samples using the Jensen–Shannon divergence (JSD) from TRAV segment usage. The figure is created with BioRender.com. b, Proportion of TRAV segment usage in samples as measured from either TRACERx TCR-seq data (separated into 4 quartiles) or predicted by ImmuneLENS. c, Correlation of Shannon entropy measurements as measured by either TRAV segments predicted by ImmuneLENS or from MiXCR (RNA-seq). d, Jensen–Shannon divergence of samples either from different or same TRACERx patients, for tumor–tumor or tumor–blood sample comparisons measured by ImmuneLENS or TCR-seq from TRAV segment proportions, with significance assessed using a two-sided Wilcoxon rank-sum test. Boxplots in b and d show the median, lower and upper quartile and with whiskers extending to 1.5× the interquartile range above and below the interquartile range. P values for Spearman’s ρ were derived from a two-tailed t-distribution using the correlation coefficient and sample size.
Extended Data Fig. 5
Extended Data Fig. 5. Pan-cancer overview of IGH and T/B cell ratio.
a. Overview snake plot of age-adjusted TCRA T cell fraction and circulating T/B cell ratio, with horizontal red line representing the median value per histology and dashed black line at y = 1 for the age-adjusted circulating TCRA T cell fraction to show the median value expected for the age distribution of that cohort.
Extended Data Fig. 6
Extended Data Fig. 6. Comparison of circulating and infiltrating fractions.
a, Boxplots showing different fractions calculated in ImmuneLENS in circulating blood and infiltrating tumor samples; pie charts show the percentage of cases when infiltrating fractions is higher or lower than circulating with significance assessed using a two-sided Wilcoxon rank-sum test. P = 0, represents P values less than the limit of double-precision floating numbers in R, 2.22 × 10308 b, Pearson correlation of infiltrating and circulating fractions within the 100KGP cohort. Dashed black line represents the Pearson correlation = 0 and separates positive and negative correlations. Multiple hypothesis adjustments were performed using the Holm–Bonferroni method. Boxplots in a show the median, lower and upper quartile and with whiskers extending to 1.5× interquartile range above and below the interquartile range. P values for Pearson’s R values were derived from a two-tailed t-distribution using the correlation coefficient and sample size.
Extended Data Fig. 7
Extended Data Fig. 7. Additional determinants of ImmuneLENS fractions.
a,b, Significance of hit SNPs from PLINK analysis for circulating TCRA T cell fraction in healthy cohorts identified in European ancestry (a) and African ancestry (b) versus their significance in the cancer cohort, with SNPs colored by their position within the chromosome to distinguish between multiple significant loci. Dashed red line represents p = 0.05 (unadjusted) in the cancer cohort. The P values are derived from the PLINK software that uses a linear regression model and performs a Wald test for each SNP. For the cancer cohort, this was done separately for each histology, and the P values were combined using a meta-analysis with a common effects model.
Extended Data Fig. 8
Extended Data Fig. 8. Association of selection with infiltrating B cell fraction.
a, Volcano plots for the significance of association of IgM/IgD and IgG infiltrating B cell fraction for selection of nonsynonymous genes from the cancer gene census as measured with Poisson model: observed mutations ~ offset(log(expected mutation)) + age + sex + purity + tumor mutation burden + disease type + infiltrating B cells, with expected mutations calculated by dNdScv, and run on the entire pan-cancer cohort excluding hematological and childhood cancers. Dashed black lines are at estimate = 0, and the FDR significance threshold of −log10(P) = 4.16. b, Bubble plot showing disease-type-specific significance from Poisson model for different infiltrating B cell fractions, with genes selected as those that are significant either at the pan-cancer level (MUC4 in IgM/IgD and KMT2C in IgG) or within a single disease-type at an adjusted P < 0.05 with genes only tested if 10 or more patients had nonsynonymous mutations within that gene in that cancer type. P values in a and b represent the significance of the term for the TCRA T cell fraction variable in the Poisson model and are calculated using a Wald test.
Extended Data Fig. 9
Extended Data Fig. 9. Survival forest plots and circulating T cell fraction and T/B cell ratio interaction.
a, Output from CoxPH models showing hazard ratio with 95% confidence intervals for 5-year survival controlled for age, sex, cancer stage and treatment before surgery. Dashed black line represents a hazard ratio of 1. b, Results from a CoxPH model for circulating TCRA T cell fraction and T/B cell ratio together with their interaction term from the 100KGP pan-cancer cohort showing hazard ratio with 95% confidence interval. Dashed black line represents a hazard ratio of 1. c,d, Kaplan–Meier curves for 5-year survival for 100KGP pan-cancer cohort separated into either low- or high-circulating T/B cell ratio or circulating TCRA T cell fraction based on the median values. Multiple hypothesis adjustments were performed using the Benjamini–Hochberg method with individual P values calculated using a two-sided Wald test within the Cox model.
Extended Data Fig. 10
Extended Data Fig. 10. Survival analysis in TCGA.
a, Five-year survival Kaplan–Meier curves for the TCGA data using the median value of TCRA T cell fraction as calculated by T cell ExTRECT to assign high and low groups. b. Left: hazard ratio associated with pan-cancer TCGA cohort with 95% confidence interval. Right: heatmap of hazard ratios for each individual cancer type with P values given in brackets. All P values were calculated using a two-sided Wald test within the Cox model. *, P < 0.05; **, P < 0.01; ***, P < 0.001. LGG, brain lower grade glioma; SARC, sarcoma; LUAD, lung adenocarcinoma; THYM, thymoma; BLCA, bladder urothelial carcinoma; CHOL, cholangiocarcinoma; STAD, stomach adenocarcinoma; UCS, uterine carcinosarcoma; PAAD, pancreatic adenocarcinoma; BRCA, breast invasive carcinoma; PRAD, prostate adenocarcinoma; PCPG, pheochromocytoma and paraganglioma; HNSC, head and neck squamous cell carcinoma; UVM, uveal melanoma; GBM, glioblastoma multiforme; CESC, cervical squamous cell carcinoma and endocervical adenocarcinoma; KIRC, kidney renal clear cell carcinoma; UCEC, uterine corpus endometrial carcinoma; SKCM, skin cutaneous melanoma; KIRP, kidney renal papillary cell carcinoma; LUSC, lung squamous cell carcinoma; ESCA, esophageal carcinoma.

References

    1. Gonzalez, H., Hagerling, C. & Werb, Z. Roles of the immune system in cancer: from tumor initiation to metastatic progression. Genes Dev.32, 1267–1284 (2018). - PMC - PubMed
    1. Rosenthal, R., Swanton, C. & McGranahan, N. Understanding the impact of immune-mediated selection on lung cancer evolution. Br. J. Cancer124, 1615–1617 (2021). - PMC - PubMed
    1. McGranahan, N. et al. Allele-specific HLA loss and immune escape in lung cancer evolution. Cell171, 1259–1271 (2017). - PMC - PubMed
    1. Kloor, M., Michel, S. & von Knebel Doeberitz, M. Immune evasion of microsatellite unstable colorectal cancers. Int. J. Cancer127, 1001–1010 (2010). - PubMed
    1. Juneja, V. R. et al. PD-L1 on tumor cells is sufficient for immune evasion in immunogenic tumors and inhibits CD8 T cell cytotoxicity. J. Exp. Med.214, 895–904 (2017). - PMC - PubMed