. 2025 Apr;23(4):1329-1344.
doi: 10.1111/pbi.14588. Epub 2025 Feb 18.

GhMYB102 affects cotton fibre elongation and secondary wall thickening by regulating GhIRX10 in cotton

Affiliations

GhMYB102 affects cotton fibre elongation and secondary wall thickening by regulating GhIRX10 in cotton

Aimin Wu et al. Plant Biotechnol J. 2025 Apr.

Abstract

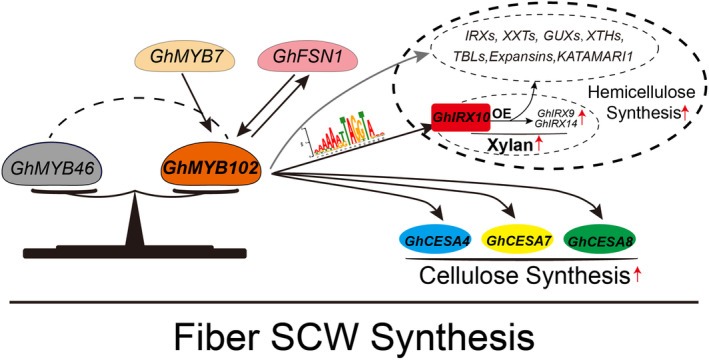
Upland cotton (Gossypium hirsutum) is a principal economic crop and a fundamental raw material for the textile industry. The quality of cotton fibres is significantly influenced by the synthesis of cell wall polysaccharides. This study focuses on GhIRX10, a beta-1,4-xylosyltransferase crucial for xylan backbone synthesis. Overexpression of GhIRX10 enhances xylan synthesis, which impacts fibre elongation and secondary cell wall thickening. GhMYB102, identified as a direct regulator of GhIRX10 expression, was confirmed through comprehensive validation. Overexpression of GhMYB102 resulted in a similar phenotype as OE-GhIRX10: increased cell wall thickness and reduced fibre length. Overexpression of GhMYB102 upregulated the expression of key cell wall synthesis-related genes, including GhCESA4/7/8, GhIRXs, GhCESAs, GhGUXs, GhTBLs, GhXTHs, and GhXXTs. Consequently, the cellulose and hemicellulose contents in OE-GhMYB102 lines were significantly increased. GhMYB102 was also validated as a target gene regulated by GhFSN1 and GhMYB7, with the ability to reciprocally regulate GhFSN1 expression. In summary, we propose a regulatory model where GhMYB102 promotes the expression of GhIRX10 and other cell wall-related genes, thereby affecting fibre quality. This study elucidates the regulatory network of secondary cell wall synthesis in cotton and provides potential targets for improving fibre quality through molecular breeding.

Keywords: GhIRX10; GhMYB102; cotton; fibre development; secondary cell wall; xylan.


Conflict of interest statement

The authors declare no conflicts of interest.

Figures

Figure 1
Figure 1
Sequence characteristics and functional analysis of IRX10 homologues in cotton. (a) Expression pattern analysis of GhIRX10 across various tissues and developmental stages of cotton fibres. Expression levels are depicted as log2(FPKM+1) to normalize the data. (b) Amino acid sequence alignment between cotton GhIRX10 homologues and AtIRX10. (c) Predicted transmembrane structure of the GhIRX10 protein, indicating potential membrane‐spanning domains. (d) Subcellular localization of GhIRX10 visualized by fluorescence microscopy. (e) The colocalization degree of GhIRX10:EGFP and Golgi marker (GmMan1‐49aa) in subcellular localization result. (f and g) Correlation analysis between GhIRX10 expression levels and fibre length, suggesting a significant association between gene expression and fibre characteristics. Data were sourced from the CottonMD database (https://yanglab.hzau.edu.cn/CottonMD).
Figure 2
Figure 2
Comparative fibre morphology and biochemical analysis of GhIRX10 transgenic lines versus wild‐type (WT) cotton. (a) The relative expression levels of GhIRX10 in transgenic lines are normalized to the endogenous reference gene GhHIS3 (GenBank accession number AF024716). The 2−ΔΔCt method was employed to calculate the relative gene expression. Data are presented as mean ± standard deviation (SD). Statistical significance was evaluated using a Student's t‐test, with **indicating P ≤ 0.01 and ***P ≤ 0.001. (b) Morphological comparison of mature fibres from GhIRX10 transgenic lines to WT, with a scale bar representing 1 cm. (c and d) High‐Volume Instrument (HVI) assessments of fibre quality for GhIRX10 transgenic lines are depicted, with triplicate measurements for statistical reliability. Results are expressed as mean ± SD, and statistical significance was determined using a Student's t‐test, with *indicating P ≤ 0.05, **P ≤ 0.01, and ***P ≤ 0.001. (e) Scanning electron microscopy (SEM) images of mature fibres from GhIRX10 transgenic lines and WT, illustrating surface characteristics. (f) Twist number in mature fibres of GhIRX10 transgenic and WT lines, with n = 30 samples. Data are presented in violin plots, where the solid and dashed lines denote the mean and quartile values, respectively. (g) Cross‐sectional views of mature fibres from GhIRX10 transgenic and WT lines, scale = 25 μm. (h) Statistical analysis of cell wall thickness in mature fibres (n = 50), with significance assessed using one‐way ANOVA, and ***indicating P ≤ 0.001. (i) Quantification of xylo‐oligosaccharides in mature fibres of GhIRX10 transgenic and WT lines. (j and k) Relative expression levels of GhIRX9/9 L and GhIRX14/14L in OE‐GhIRX10 lines, normalized to GhHIS3. The 2−ΔΔCt method was used for relative quantification. Results are presented as mean ± SD, and statistical significance was determined using a Student's t‐test, with **indicating P ≤ 0.01 and ***P ≤ 0.001. The sample features shown in the image results are representative of the typical characteristics observed within this study category.
Figure 3
Figure 3
Identification and analysis of differentially expressed genes (DEGs) in 20 DPA fibres between GhIRX10 transgenic lines and WT. (a) A Venn diagram represents the overlap of DEGs among OE‐GhIRX10 lines. (b) GO enrichment analysis for the 281 downregulated genes in OE‐GhIRX10 lines. (c) Expression patterns of the 281 downregulated genes throughout fibre development, with expression levels shown as log2(FPKM+1) following row‐wise normalization for visual comparison. (d) A volcano plot illustrates DEGs between RNAi‐GhIRX10 and WT lines. (e) GO enrichment results for Up‐DEGs in RNAi‐GhIRX10 lines. (f) KEGG pathway enrichment analysis for Up‐DEGs in RNAi‐GhIRX10 lines. (g) Statistical categorization of upregulated transcription factors in RNAi‐GhIRX10 lines. (h) Expression patterns of upregulated transcription factors during fibre development, with expression levels depicted using log2(FPKM+1) and normalized by row standardization.
Figure 4
Figure 4
Regulation of GhIRX10 expression by GhMYB102 through specific ‘TTAGGT’ motifs. (a) Identification of MYB binding sites (MBS) within the promoter region of GhIRX10, motif matrix data from JASPAR. (b) A schematic overview of the GhIRX10 promoter segmented into regions based on the distribution of MBSs, with red lines indicating the positions of these sites. (c) β‐Glucuronidase (GUS) reporter assays demonstrating the transcriptional activity of various GhIRX10 promoter fragments. (d) The relative expression levels of GhIRX10 and GhMYB102 in mult‐tissues and multi‐period fibres were determined using the 2−ΔΔCt method, with results shown as mean ± standard deviation (SD). (e) Illustration of the conserved domains within the amino acid sequence of GhMYB102. (f) Yeast one‐hybrid (Y1H) assays confirming the binding of GhMYB102 to the GhIRX10 promoter, with the inclusion of 150 mM 3‐aminotriazole (3‐AT) to inhibit self‐activation. (g and h) Dual‐luciferase reporter (DLR) assays validating the transcriptional activation of the GhIRX10 promoter by GhMYB102. The relative fluorescence quantitative results of the DLR assay are normalized using Renilla luciferase (REN) as an internal reference. Data are presented as mean ± SD from three independent experiments, with statistical significance assessed using a Student's t‐test. (i) Electrophoretic mobility shift assay (EMSA) demonstrating the binding of GhMYB102 protein to three MBSs within the GhIRX10 promoter. (j) Expression levels of GhMYB102 are significantly upregulated in RNAi‐GhIRX10 lines, with statistical analysis performed using a Student's t‐test, where **indicates P ≤ 0.01 and ***P ≤ 0.001. (k) Relative expression of GhIRX10 in OE‐GhMYB102 lines, with GhHIS3 used as an internal control for normalization. The relative expression is calculated using the 2−ΔΔCt method, with results presented as mean ± SD. Statistical significance is determined using a Student's t‐test, where **indicates P ≤ 0.01 and ***P ≤ 0.001.
Figure 5
Figure 5
Impact of GhMYB120 overexpression on fibre elongation and secondary wall thickening. (a) Relative expression levels of GhMYB102 in OE‐GhMYB102 lines. Each line was independently assayed three times, with results presented as mean ± standard deviation (SD). Statistical significance was determined using a Student's t‐test, with **indicating P ≤ 0.01 and ***indicating P ≤ 0.001. (b) Morphological comparison of mature fibres between OE‐GhMYB102 and WT lines. (c and d) Fibre length and strength measurements of OE‐GhMYB102 and WT lines obtained through HVI fibre testing. Each line was independently tested three times, with data shown as mean ± SD. Statistical analysis was conducted using a Student's t‐test, with *indicating P ≤ 0.05 and **indicating P ≤ 0.01. (e) Cross‐sectional images of mature fibres from OE‐GhMYB102 and WT lines, scale bar = 25 μm. (f) Cell wall thickness of mature fibres from OE‐GhMYB102 and WT lines, with n = 50 samples. Significance was determined using one‐way ANOVA, with **indicating P ≤ 0.01 and ***indicating P ≤ 0.001. The sample features illustrated in the image results are representative of the typical characteristics observed within this study category.
Figure 6
Figure 6
Identification and functional analysis of GhMYB102 whole genome target gene. (a) Genome‐wide distribution of DAP‐seq peaks for GhMYB102. (b) Statistical analysis of the distances of these peaks from the transcription start sites (TSS). (c) Identification of the core binding motif for GhMYB102, which is significantly enriched as revealed by DAP‐seq analysis. (d) Comparative analysis of the GhMYB102's motif with other related motifs, highlighting similarities that may dictate target gene specificity. (e) GO enrichment results for the 1583 potential targets genes of GhMYB102. (f) Venn diagram analysis of the overlap between the Up‐DEGs in OE‐GhMYB102 lines and the 1583 potential target genes. (g) GO enrichment analysis of the 239 overlapping target genes of GhMYB102. (h) Quantification of cellulose and hemicelluloses in mature fibres of OE‐GhMYB102 and WT lines. Data expressed as mean ± SD from three replicates. Significance analysis was performed using a Student's t‐test, with *indicating P ≤ 0.05 and **indicating P ≤ 0.01.
Figure 7
Figure 7
GhMYB102 positively regulates the expression of GhCESA4, 7 and 8. (a) A heatmap depicting the expression levels of GhCESA4, GhCESA7, and GhCESA8 in OE‐GhMYB102 and WT lines. Expression levels are represented in log2(FPKM+1) and normalized by row standardization. (b) Quantitative assessment of the relative expression levels of GhCESA4, GhCESA7, and GhCESA8 in OE‐GhMYB102 and WT lines. GhHIS3 was utilized as an internal control for normalization. The relative expression was determined using the 2−ΔΔCt method, and results are presented as mean ± SD. Statistical significance was assessed using a Student's t‐test, with *indicating P ≤ 0.05, **indicating P ≤ 0.01 and ***indicating P ≤ 0.001. (c) EMSA confirming the direct binding of GhMYB102 to the promoter regions of GhCESA4, GhCESA7, and GhCESA8.
Figure 8
Figure 8
GhMYB102 is directly regulated by GhFSN1. (a) The distribution of MYB and NAC transcription factor recognition elements in the GhMYB102 promoter sequence. (b) Significant upregulation of GhMYB102 in OE‐GhFSN1 lines, cited from Zhang et al., . (c) Dual‐Luciferase Reporter (DLR) assays confirm that GhFSN1 significantly activates the expression of GhMYB102. (d) EMSA confirms the binding of GhFSN1 to two recognition sites in the GhMYB102 promoter. (e) RNA‐seq data and RT‐qPCR results confirmed that the expression of GhFSN1 was significantly upregulated in OE‐GhMYB102 lines. (f and g) Electrophoretic Mobility Shift Assay (EMSA) revealing the direct binding of GhMYB102 to two specific recognition sites within the promoter region of GhFSN1.
Figure 9
Figure 9
Schematic representation of the molecular regulatory network involving GhMYB102 and GhIRX10 in secondary cell wall synthesis of cotton fibres. The grey lines indicate the interactions revealed by RNA‐seq data, while the black lines represent regulatory relationships validated through molecular experiments. This molecular model serves as a framework for understanding the role of GhMYB102 and GhIRX10 in fibre development and could guide future research in cotton improvement.

References

    1. Anders, N. , Wilson, L.F.L. , Sorieul, M. , Nikolovski, N. and Dupree, P. (2023) β‐1,4‐Xylan backbone synthesis in higher plants: How complex can it be? Front. Plant Sci. 13, 1076298. - PMC - PubMed
    1. Bailey, T.L. , Johnson, J. , Grant, C.E. and Noble, W.S. (2015) The MEME Suite. Nucleic Acids Res. 43, W39–W49. - PMC - PubMed
    1. Bartlett, A. , O'Malley, R.C. , Huang, S.‐S.C. , Galli, M. , Nery, J.R. , Gallavotti, A. and Ecker, J.R. (2017) Mapping genome‐wide transcription‐factor binding sites using DAP‐seq. Nat. Protoc. 12, 1659–1672. - PMC - PubMed
    1. Brown, D.M. , Zhang, Z. , Stephens, E. , Dupree, P. and Turner, S.R. (2009) Characterization of IRX10 and IRX10‐like reveals an essential role in glucuronoxylan biosynthesis in Arabidopsis . Plant J. 57, 732–746. - PubMed
    1. Chen, X. , Vega‐Sánchez, M.E. , Verhertbruggen, Y. , Chiniquy, D. , Canlas, P.E. , Fagerström, A. , Prak, L. et al. (2013) Inactivation of OsIRX10 leads to decreased Xylan content in rice culm cell walls and improved biomass saccharification. Mol. Plant 6, 570–573. - PubMed

LinkOut - more resources