. 2025 Feb 18;18(1):60.
doi: 10.1186/s13071-025-06704-3.

BBSome deficiency in Lotmaria passim reveals divergent functions in trypanosomatid parasites

Affiliations

BBSome deficiency in Lotmaria passim reveals divergent functions in trypanosomatid parasites

Xuye Yuan et al. Parasit Vectors. .

Abstract

Background: The BBSome is an octameric protein complex crucial for ciliary transport, though it also participates in multiple other cellular processes. These diverse functions may result from the co-option of its ancestral roles. Studying the BBSome in flagellated protists can provide insights into these ancestral functions and their subsequent adaptations.

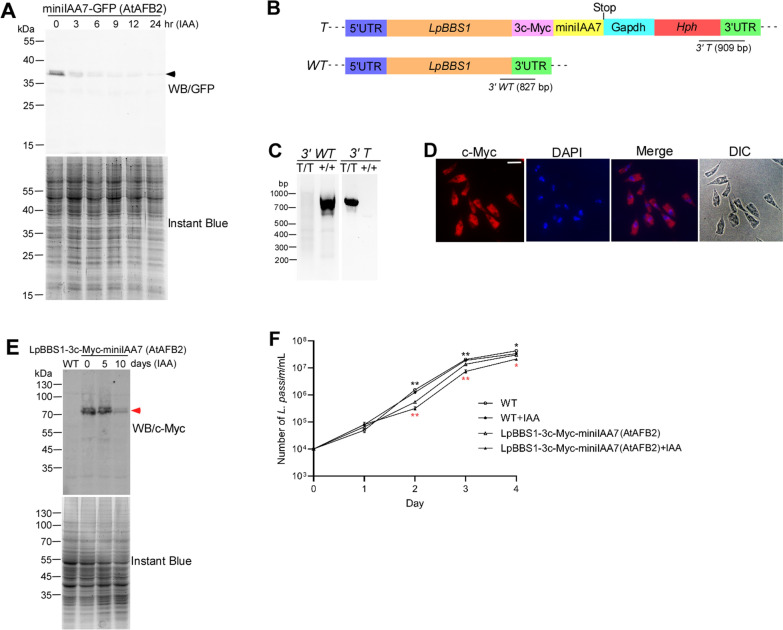
Methods: We examined the functions of the BBSome (LpBBS1 and LpBBS2) in Lotmaria passim, a monoxenous trypanosomatid parasite infecting honey bees. The phenotypes resulting from depletion of LpBBS1 using the auxin-inducible degron system and disruption of LpBBS2 were characterized.

Results: Parasites deficient in LpBBS2 are smaller and less motile compared with wild-type. Although intraflagellar transport of a marker membrane protein is only mildly impaired, its association with lipid rafts is significantly disrupted in the mutants. This suggests that the BBSome is essential for maintaining lipid raft integrity in L. passim. Transcriptomic comparisons between wild-type and LpBBS2-deficient parasites reveal that the BBSome may also influence processes related to metabolism, membrane localization of specific proteins, DNA repair, microtubules, and mitochondria.

Conclusions: In contrast to Leishmania mexicana, the BBSome in L. passim is crucial for efficient infection of the honey bee gut, demonstrating that its cellular functions vary between related trypanosomatid species. The BBSome is likely an adaptor that links multiple proteins in a species-specific manner under various cellular contexts.

Keywords: Lotmaria passim; BBSome; Lipid raft; Trypanosomatid parasite.


Conflict of interest statement

Declarations. Ethics approval and consent to participate: This article does not contain any studies with human participants performed by any of the authors. Consent for publication: All authors consented to publish the article. Competing interests: The authors declare no competing interests.

Figures

Fig. 1
Fig. 1
Cellular localizations of LpBBS1, LpBBS2, and LpIFT88-GFP. Lotmaria passim expressing 3c-Myc-LpBBS1 or 3c-Myc-LpBBS2, along with wild-type (WT) controls, were analyzed via immunofluorescence (c-Myc), DAPI staining, and differential interference contrast (DIC) microscopy. LpIFT88-GFP was directly visualized using fluorescence light (GFP). Merged images of c-Myc and DAPI are provided. Scale bar: 5 μm
Fig. 2
Fig. 2
AID-mediated functional analysis of LpBBS1. A L. passim expressing degron-tagged GFP and AtAFB2, miniIAA7-GFP (AtAFB2), was treated with IAA for 0–24 h. Cell lysates were analyzed by 12% SDS-PAGE, followed by western blot with anti-GFP antibody (WB/GFP) and Instant Blue staining. The miniIAA7-GFP band is marked by an arrowhead. Protein marker molecular weights (kDa) are indicated on the left. B Schematic representation of wild-type (WT) and tagged (T) alleles of LpBBS1, created via CRISPR/Cas9-induced homology-directed repair. The 5′ and 3′ untranslated regions (UTRs), open reading frame (ORF), 3c-Myc epitopes, miniIAA7, Trypanosoma cruzi Gapdh terminator, and hygromycin resistance gene (Hph) are color-coded. The stop codon is indicated. Expected PCR product sizes for detecting 3′ WT and 3′ T alleles (not to scale) are also shown. C Genomic DNA from WT (+ / +) and homozygous tagged LpBBS1 clones (T/T) was analyzed by PCR to detect 3′ WT and 3′ T alleles. Molecular weight marker sizes are shown on the left. D The homozygous tagged LpBBS1 clone, LpBBS1-3c-Myc-miniIAA7, was examined using immunofluorescence (c-Myc), DAPI staining, and differential interference contrast (DIC) microscopy. The merged images of c-Myc and DAPI are also shown. Scale bar: 5 μm. E Cell lysates from LpBBS1-3c-Myc-miniIAA7 parasites expressing AtAFB2, LpBBS1-3c-Myc-miniIAA7 (AtAFB2), treated with IAA for 0–10 days, and untreated WT parasites were analyzed by 8% SDS-PAGE. LpBBS1-3c-Myc-miniIAA7 protein (red arrowhead) was detected via western blot using anti-c-Myc antibody (WB/c-Myc), with total proteins visualized by Instant Blue staining. F Growth rates of WT (white circles), WT with IAA (+ IAA, black circles), LpBBS1-3c-Myc-miniIAA7 (AtAFB2) (clone E9, white triangles), and LpBBS1-3c-Myc-miniIAA7 (AtAFB2) with IAA (+ IAA, black triangles) were monitored in culture for 4 days at 30 °C (biological replicates, n = 3). Growth differences between WT and LpBBS1-3c-Myc-miniIAA7 (AtAFB2) without IAA (black asterisks, day 2; P < 0.002, day 3; P < 0.003, day 4; P < 0.02) and between treated and untreated LpBBS1-3c-Myc-miniIAA7 (AtAFB2) (red asterisks, day 2; P < 0.003, day 3; P < 0.002, day 4; P < 0.02) were statistically significant (two-tailed Welch’s t-test)
Fig. 3
Fig. 3
CRISPR-mediated disruption of LpBBS2. A Schematic representation of WT and disrupted (KO) alleles of LpBBS2 generated via CRISPR/Cas9-induced homology-directed repair. 5′ and 3′ UTRs, ORF, and Hph are color-coded. Expected PCR product sizes for detecting 5′ WT, 3′ WT, 5′ KO, and 3′ KO alleles (not to scale) are shown. B Genomic DNA from WT (+ / +), heterozygous ( ±), and homozygous (−/−) LpBBS2-mutant parasites was analyzed by PCR for 5′ WT, 5′ KO, 3′ WT, and 3′ KO alleles. Molecular weight markers are shown on the left. C RT-PCR detection of LpBBS2 and LpGAPDH mRNAs in LpBBS2 heterozygous and homozygous mutants, along with WT parasites, using a forward primer targeting the L. passim splice leader sequence. Molecular weight markers are shown on the left
Fig. 4
Fig. 4
Phenotypes of LpBBS2-deficient mutants in culture and honey bees. A Growth rates of WT (circles), LpBBS2 homozygous mutant (clone D8, triangles), and LpBBS2-rescued (squares) parasites were measured at 30 °C over 5 days (biological replicates, n = 3). B Growth rates of WT, LpBBS2 homozygous mutant, and LpBBS2-rescued parasites were measured at 21 °C over 5 days (biological replicates, n = 3). Statistically significant differences in growth rates between WT and LpBBS2 mutants across days 1–5 are indicated (asterisks, day 1; P < 0.02, day 2; P < 0.005, day 3; P < 0.001, day 4; P < 0.001, and day 5; P < 0.001, two-tailed Dunnett test). C Morphology of WT, LpBBS2 homozygous mutant, and LpBBS2-rescued parasites. Scale bar: 2 μm. D Flagellar length comparisons between WT (n = 49), LpBBS2 homozygous mutant (n = 38), and LpBBS2-rescued (n = 30) parasites. The median value, along with the 95% confidence intervals (CI), is shown. Flagellar length significantly differs between WT and LpBBS2 mutants (P < 0.02) but not LpBBS2-rescued parasites (ns). E Cell body length comparisons between WT (n = 49), LpBBS2 homozygous mutant (n = 38), and LpBBS2-rescued (n = 30) parasites. Cell body length significantly differs between WT and LpBBS2 mutants (P < 0.001) as well as LpBBS2-rescued parasites (P < 0.02). F Motility (total distance moved in 1 min) of WT (n = 1415), LpBBS2 homozygous mutant (n = 1178), and LpBBS2-rescued (n = 2385) parasites is shown via violin plot. Median, first, and third quartiles are indicated by solid and dashed lines, respectively. Motility significantly differs between WT and LpBBS2 mutants (P < 0.001) but not LpBBS2-rescued parasites (ns). G Relative abundance of L. passim in individual honey bees (n = 24) 14 days post-infection, comparing WT, LpBBS2 homozygous mutant, and LpBBS2-rescued parasites. Data is normalized to one sample infected with WT L. passim as 1, and the median with 95% CI is presented. Infection to honey bees significantly differs between WT and LpBBS2 mutants (P < 0.01) but not LpBBS2-rescued parasites (ns). Statistical analysis was conducted using a two-tailed Steel test
Fig. 5
Fig. 5
Localization and lipid raft association of LpFCaBP1N16::GFP and LpFCaBP2N16::GFP in WT and LpBBS2-deficient parasites. WT and LpBBS2 mutant L. passim expressing LpFCaBP1N16::GFP or LpFCaBP2N16::GFP were observed under DIC and fluorescence microscopy. Merged images are shown. Scale bar: 2 μm. B Comparison of GFP fluorescence ratios (flagellum to cell body) between WT (n = 34) and LpBBS2 mutants (n = 37) The median value, along with 95% CI, is shown, and statistical analysis was conducted using the Brunner–Munzel test. C WT and LpBBS2-mutant parasites expressing LpFCaBP1N16::GFP or LpFCaBP2N16::GFP were solubilized in 1% Triton X-100 at either 4, 20, or 37 °C, and the soluble (S) and pellet (P) fractions were analyzed by western blot using anti-GFP antibody. Molecular weights of protein markers are indicated on the left. D GFP band intensity ratio (P/S) from parasites solubilized at 20 °C is compared between WT and LpBBS2 mutants (biological replicates, n = 3). The results are presented as the mean value ± standard deviation (SD). Statistical analysis was conducted using a two-tailed Welch’s t-test. E WT and LpBBS2-mutant parasites expressing GFP were solubilized in 1% Triton X-100 at different temperatures, and the soluble (S) and pellet (P) fractions were analyzed by western blot using anti-GFP antibody. Molecular weights of protein markers are indicated on the left
Fig. 6
Fig. 6
Quantification of differentially expressed mRNAs between WT and LpBBS2-deficient parasites by qRT-PCR. A and B Relative expression levels of dynein heavy chain, poly (ADP-ribose) polymerase (PARP), anti-silencing protein (Asf1), fructose-1,6-bisphosphate aldolase (Aldolase), pre-rRNA-processing protein (PNO1), 20S proteasome β6 subunit (PSMB6), 60S ribosomal protein L18 (RPL18), and uridine kinase mRNAs in WT (n = 5) and LpBBS2-deficient (n = 5) parasites. Data are normalized to one WT sample set as 1 for each mRNA and presented as mean ± SD. Statistical significance was determined using a two-tailed Welch’s t-test

References

    1. Reiter JF, Blacque OE, Leroux MR. The base of the cilium: roles for transition fibres and the transition zone in ciliary formation, maintenance and compartmentalization. EMBO Rep. 2012;13:608–18. - PMC - PubMed
    1. Kozminski KG, Johnson KA, Forscher P, Rosenbaum JL. A motility in the eukaryotic flagellum unrelated to flagellar beating. Proc Natl Acad Sci U S A. 1993;90:5519–23. - PMC - PubMed
    1. Singh SK, Gui M, Koh F, Yip MC, Brown A. Structure and activation mechanism of the BBSome membrane protein trafficking complex. Elife. 2020;9:e53322. 10.7554/eLife.53322. - PMC - PubMed
    1. Klink BU, Gatsogiannis C, Hofnagel O, Wittinghofer A, Raunser S. Structure of the human BBSome core complex. Elife. 2020;9:e53910. 10.7554/eLife.53910. - PMC - PubMed
    1. Yang S, Bahl K, Chou HT, Woodsmith J, Stelzl U, Walz T, et al. Near-atomic structures of the BBSome reveal the basis for BBSome activation and binding to GPCR cargoes. Elife. 2020;9:e55954. 10.7554/eLife.55954. - PMC - PubMed

Substances

LinkOut - more resources