. 2025 Jan 11;28(2):111805.
doi: 10.1016/j.isci.2025.111805. eCollection 2025 Feb 21.

Pseudomonas aeruginosa aggregates elicit neutrophil swarming

Affiliations

Pseudomonas aeruginosa aggregates elicit neutrophil swarming

Eliana Drenkard et al. iScience. .

Abstract

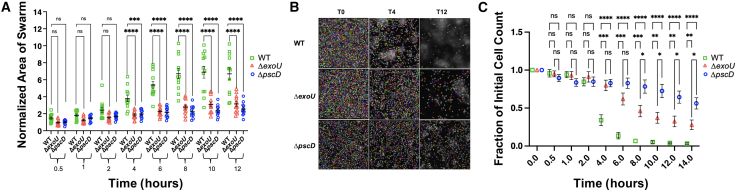
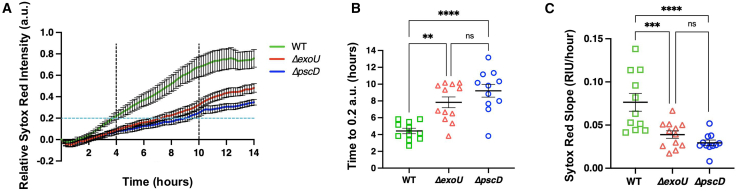
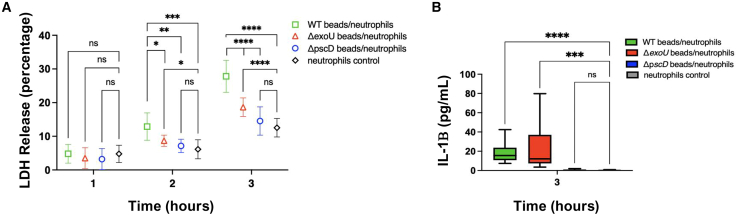
Pseudomonas aeruginosa, a gram-negative multidrug-resistant (MDR) opportunist, belongs to the ESKAPE group of pathogens associated with the highest risk of mortality. Neutrophil swarming is a host defense strategy triggered by larger threats, where neutrophil swarms contain and clear damage/infection. Current ex vivo models designed to study neutrophil-pathogen interactions largely focus on individual neutrophil engagement with bacteria and fail to capture neutrophil swarming. Here, we report an ex vivo model that reproducibly elicits neutrophil swarming in response to bacterial aggregates. A rapid and robust swarming response follows engagement with pathogenic targets. Components of the type III secretion system (T3SS), a critical P. aeruginosa virulence determinant, are involved in swarm interaction. This ex vivo approach for studying neutrophil swarming in response to large pathogen targets constitutes a valuable tool for elucidating host-pathogen interaction mechanisms and for evaluating novel therapeutics to combat MDR infections.

Keywords: Medical Microbiology; Microbiology.


Conflict of interest statement

Author BPH and DI are Guest Editors for the Swarming across the biological spectrum Special Issue published in iScience.

Figures

None
Graphical abstract
Figure 1
Figure 1
Neutrophil swarming response induced by P. aeruginosa-embedded agar beads (A) Agar beads embedded with GFP-expressing P. aeruginosa were analyzed using fluorescent microscopy immediately after preparation (T0) and after incubation in sterile liquid LB media for 20-h (T20). Scale bar is 200 μm. (B) Four PDMS microwell arrays were mounted into each well of a 12-well glass bottom plate to facilitate close contact between agar beads and neutrophils during image analysis.. (C) Images show progression of neutrophil swarming response induced by P. aeruginosa beads during 14-h time lapse. Images show Brightfield, Hoechst staining, GFP (green fluorescence), and Sytox Deep Red (red fluorescence). Scale bar is 200 μm. (D) Areas of swarm were quantified over time after swarms were segmented manually using the image processing software FIJI. Dense regions of Hoechst-stained nuclei surrounding agar beads were used to identify swarm area boundaries. Beads embedded with heat-killed bacteria and no bacteria were examined for comparison. Intensity datapoints were normalized to the initial measurement. (E) Cell quantification was performed using the cell segmentation algorithm Cellpose. The algorithm identified, segmented, and counted Hoechst-stained neutrophil nuclei within the images. Beads containing heat-killed bacteria, or no bacteria, were examined for comparison. Four independent replicates were performed for each experiment, and data are representative of three independent experiments. Error bars represent mean ± standard deviation. P values indicating significance are depicted as follows: ∗p < 0.05, ∗∗p < 0.01, ∗∗∗p < 0.001, ∗∗∗∗p < 0.0001, ns is non-significant.
Figure 2
Figure 2
Role of P. aeruginosa T3SS in neutrophil swarming response and neutrophil cell death (A) Areas of swarm were imaged over 14 h in assays performed with beads containing wild-type, ΔexoU and ΔpscD mutants. Intensity datapoints were normalized to the initial measurement. (B) Images obtained using Hoechst-stained time-lapse imaging show neutrophils incubated with wild-type, ΔexoU and ΔpscD mutant beads. Cellpose frames show segmented neutrophil nuclei identified with pixel-level labels for quantification of neutrophil cell loss. (C) Cell death quantification was performed using the cell segmentation algorithm Cellpose during swarming interaction with P. aeruginosa beads. Beads containing wild-type, ΔexoU and ΔpscD mutants were used in swarming assays. Four independent replicates were done for each experiment, and data are representative of three independent experiments. Error bars represent mean ± standard deviation. P values indicating significance are depicted as follows: ∗p < 0.05, ∗∗p < 0.01, ∗∗∗p < 0.001, ∗∗∗∗p < 0.0001, ns is non-significant.
Figure 3
Figure 3
Role of P. aeruginosa T3SS in neutrophil cell death (A) Sytox Deep Red stain was used to quantify extracellular nuclear material as an indicator of neutrophil cell death. Intensity profiles were measured within each time-lapse frame and plotted over time. Intensity datapoints were normalized to the initial measurement. Biological replicates of each condition were averaged for graphical representation. Vertical dotted lines indicate the time frame for rapid swarm expansion (4–10 h). (B) Comparison of time point at which relative Sytox Deep Red intensity reaches 0.2 a.u. (arbitrary units) during swarm assays using wild-type, ΔexoU and ΔpscD beads. (C) Sytox Red Slope analysis during rapid swarm expansion showing rate of DNA release. Four independent replicates were performed for each experiment, and data are representative of three independent experiments. Error bars represent mean ± standard deviation. P values indicating significance are depicted as follows: ∗∗p < 0.01, ∗∗∗p < 0.001, ∗∗∗∗p < 0.0001, ns is non-significant.
Figure 4
Figure 4
Role of T3SS in cell lysis and production of IL-1β during neutrophil swarming response (A) LDH release was used to assess neutrophil cell lysis. Cytotoxicity was expressed as percentage of total amount of LDH released in culture supernatants. (B) Quantification of cytokine IL-1β was done using an enzyme-linked immunosorbent assay. Measurements of LDH release and production of IL-1β were done using supernatants from swarming assays performed using wild-type, ΔexoU and ΔpscD beads. Four independent replicates were done for each experiment, and data are representative of three independent experiments. Error bars represent mean ± standard deviation. P values indicating significance are depicted as follows: ∗p < 0.05, ∗∗p < 0.01, ∗∗∗p < 0.001, ∗∗∗∗p < 0.0001, ns is non-significant.
Figure 5
Figure 5
Survival of P. aeruginosa bacteria during interaction with neutrophil swarms Bacterial survival was quantified by counting CFUs after 3-h incubation of bacteria-embedded beads and neutrophils (PMN). Samples containing P. aeruginosa beads without neutrophils were used as negative controls. Data correspond to the average ±SD of four independent replicates per condition representative of three independent experiments (N = 12). Comparisons between groups were performed using two-tailed Student’s t test. p < 0.05 was considered significant. P values indicating significance are depicted as follows: ∗∗p < 0.01, ∗∗∗p < 0.001, ns is non-significant.

References

    1. Cendra M.D.M., Torrents E. Pseudomonas aeruginosa biofilms and their partners in crime. Biotechnol. Adv. 2021;49 doi: 10.1016/j.biotechadv.2021.107734. - DOI - PubMed
    1. Jurado-Martin I., Sainz-Mejias M., McClean S. Pseudomonas aeruginosa: An Audacious Pathogen with an Adaptable Arsenal of Virulence Factors. Int. J. Mol. Sci. 2021;22:3128. doi: 10.3390/ijms22063128. - DOI - PMC - PubMed
    1. Rossi E., La Rosa R., Bartell J.A., Marvig R.L., Haagensen J.A.J., Sommer L.M., Molin S., Johansen H.K. Pseudomonas aeruginosa adaptation and evolution in patients with cystic fibrosis. Nat. Rev. Microbiol. 2021;19:331–342. doi: 10.1038/s41579-020-00477-5. - DOI - PubMed
    1. Boucher H.W., Talbot G.H., Bradley J.S., Edwards J.E., Gilbert D., Rice L.B., Scheld M., Spellberg B., Bartlett J. Bad bugs, no drugs: no ESKAPE! An update from the Infectious Diseases Society of America. Clin. Infect. Dis. 2009;48:1–12. doi: 10.1086/595011. - DOI - PubMed
    1. Gipson K.S., Nickerson K.P., Drenkard E., Llanos-Chea A., Dogiparthi S.K., Lanter B.B., Hibbler R.M., Yonker L.M., Hurley B.P., Faherty C.S. The Great ESKAPE: Exploring the Crossroads of Bile and Antibiotic Resistance in Bacterial Pathogens. Infect. Immun. 2020;88 doi: 10.1128/IAI.00865-19. - DOI - PMC - PubMed

LinkOut - more resources