. 2025 Jan 16;28(2):111802.
doi: 10.1016/j.isci.2025.111802. eCollection 2025 Feb 21.

Rapid and relaying deleterious effects of a gastrointestinal pathogen, Citrobacter rodentium, on bone, an extra-intestinal organ

Affiliations

Rapid and relaying deleterious effects of a gastrointestinal pathogen, Citrobacter rodentium, on bone, an extra-intestinal organ

Kunal Sharan et al. iScience. .

Abstract

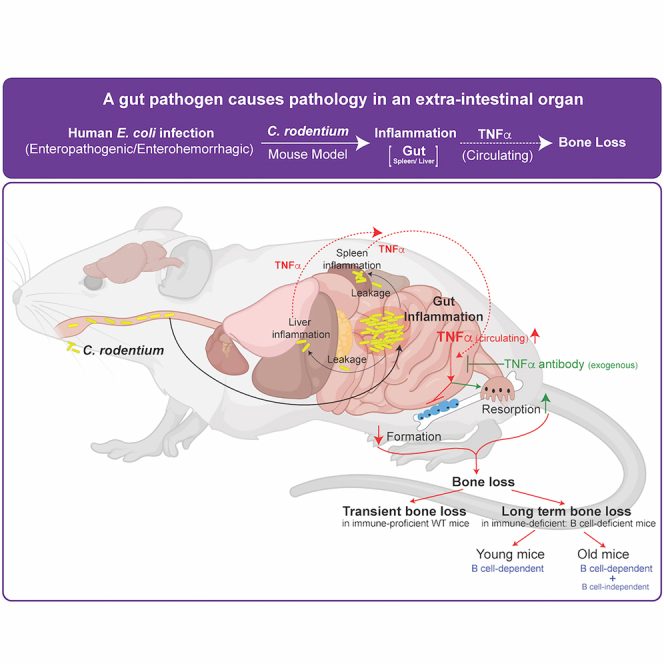
Enteropathogenic infections cause pathophysiological changes in the host but their effects beyond the gastrointestinal tract are undefined. Here, using Citrobacter rodentium infection in mouse, which mimics human diarrheal enteropathogenic Escherichia coli, we show that gastrointestinal infection negatively affects bone remodeling, leading to compromised bone architecture. Transmission of infection through fecal-oral route from Citrobacter rodentium-infected to non-infected mice caused bone loss in non-infected cage mates. Mice with B cell deficiency (Igh6-/- mice) failed to clear C. rodentium infection and exhibited more severe and long-term bone loss compared to WT mice. Unbiased cytokine profiling showed an increase in circulating tumor necrosis factor α (TNFα) levels following Citrobacter rodentium infection, and immunoneutralization of TNFα prevented infection-induced bone loss completely in WT and immunocompromised mice. These findings reveal rapid, relaying, and modifiable effects of enteropathogenic infections on an extraintestinal organ-bone, and provide insights into the mechanism(s) through which these infections affect extraintestinal organ homeostasis.

Keywords: Gastroenterology; Immune response; Molecular physiology.


Conflict of interest statement

All the authors declared no competing interests.

Figures

None
Graphical abstract
Figure 1
Figure 1
Citrobacter rodentium infection of the gut causes bone loss in wild-type mice (A) Schematic representation of the experimental regimen. (B) Bacterial shedding analysis using the colony forming unit (CFU) assay in feces at different time points post inoculation of vehicle/C. rodentium in wild-type (WT) mice. (C) The CFU assay in feces and blood collected on day 12, and in the spleen, liver, and bone collected on day 12 and 28 from WT mice inoculated with vehicle/C. rodentium. Scale bar, 20 mm. (D) Representative images showing the colon histology, 2 weeks post vehicle/C. rodentium inoculation in WT mice and colonic hyperplasia in infected mice. Scale bar, 100 μm. (E and F) Representative images of lumbar 4 vertebra, with quantification of bone volume to total volume percentage (BV/TV%) in female (E) and male (F) WT mice, 4 weeks post vehicle/C. rodentium inoculation. Scale bar, 1 mm. (G–I) Toluidine blue staining of osteoblasts with quantification of Ob.N./T.Ar. and Ob.S./BS showing reduced osteoblast numbers and surface on bone (G), calcein double labeling detecting bone formation fronts, and quantification of bone formation rate and mineral apposition rates (H), and tartrate-resistant alkaline phosphatase-stained osteoclasts (red), with quantification of osteoclast numbers per bone perimeter, osteoclast surface per bone surface (Oc.S./BS), and serum deoxypyridinoline levels (I) in bones of female mice, 4 weeks post vehicle or C. rodentium inoculation. Osteoblasts are marked with arrows, and osteoclast surface with red line on the bone surface (dotted lines). Scale bar, 20 μm (G). Scale bar, 50 μm (H). Scale bar, 20 μm (I). Values are mean ± SEM. n for each group is indicated within each panel. ∗p < 0.05.
Figure 2
Figure 2
Transmission of Citrobacter rodentium infection causes low bone volume in initially uninfected cage-mates (A) Schematic representation of the experimental regimen used. (B and C) Bacterial shedding analysis using the colony forming unit (CFU) assay in feces at different time points (B), and bacterial CFU analysis at day 16 in feces (C) post vehicle/C. rodentium inoculation in infected and uninfected cage mates. Scale bar, 20 mm. (D) Histological and histomorphometric analysis of lumbar 4 vertebra, with quantification of bone volume over total volume % (BV/TV%). Scale bar, 1 mm (E) 3D μCT images of proximal tibia, with quantification of bone volume over total volume % (BV/TV%), trabecular numbers (Tb.N.), trabecular thickness (Tb.Th.), trabecular separation (Tb.Sp.), and cortical thickness (Ct.Th.), 4-week post vehicle/C. rodentium inoculation in infected and uninfected cage mates. Scale bar, 1 mm. (F–H) Representative photomicrographs of toluidine blue-stained osteoblasts and quantification of osteoblast numbers per trabecular area (Ob.N./T.Ar.) (F), bone formation rate (BFR) and mineral apposition rate (MAR) (G), and osteoclast surface per bone surface % (OcS/BS%) (H) 4-week post vehicle or C. rodentium inoculation in infected and initially uninfected cage mates. Scale bar, 20 μm (F). Scale bar, 50 μm (G). Scale bar, 20 μm (H). Values are mean ± SEM. n for each group is indicated within each panel. ∗p < 0.05.
Figure 3
Figure 3
Immunocompromised mice that lack B cells (Igh6−/−) show more severe and sustained bone loss than wild-type (WT) mice following Citrobacter rodentium infection (A) Schematic representation of the experimental regimen used and bacterial shedding analysis using the colony forming unit (CFU) assay in feces at different time points in WT (uninfected), WT (infected), Igh6−/− (uninfected), and Igh6−/− (infected) mice. (B) Colony forming unit (CFU) assay in feces, bone, spleen, and liver at day 42 post vehicle or C. rodentium inoculation in WT (uninfected), WT (infected), Igh6−/− (uninfected), and Igh6−/− (infected) mice. Scale bar, 20 mm. (C and D) 3D μCT images of proximal tibia, with quantification of bone volume over total volume percentage (BV/TV%) and cortical thickness (Ct. Th.) 4- (C) and 7-week (D) post vehicle/C. rodentium inoculation in WT or Igh6−/− mice. Scale bar, 1 mm. (E) Histological and histomorphometric analysis of lumbar 4 vertebra (Scale bar, 1 mm), with quantification of bone volume over total volume % (BV/TV%), osteoblast numbers per trabecular area (Ob.N./T.Ar. Scale bar, 20 μm), bone formation rate (BFR; Scale bar, 50 μm), mineral apposition rate (MAR), and osteoclast surface per bone surface % (OcS/BS%; Scale bar, 20 μm) 7-week post vehicle/C. rodentium inoculation in WT or Igh6−/− mice. Representative micrographs for different histological analysis are shown in panel E. Values are mean ± SEM. n for each group is indicated within each panel. ∗p < 0.05.
Figure 4
Figure 4
Tumor necrosis factor α (TNFα) mediates Citrobacter rodentium infection-induced bone loss (A) Schematic representation of the experimental regimen and heatmap showing levels of various cytokines in wild-type (WT) mice at 1-, 2-, and 4-week post vehicle/C. rodentium inoculation. (B) Bubble plot showing levels of cytokines in WT mice at 1 week post vehicle/C. rodentium inoculation. (C) TNFα levels in WT mice at 1-, 2-, and 4-week post vehicle/C. rodentium inoculation. (D) TNFα levels in WT or Igh6−/− mice at different time points post vehicle or C. rodentium inoculation. (E and F) Histological and histomorphometric analysis of lumbar 4 vertebra (Scale bar, 1 mm), with quantification of BV/TV%, Ob.N/T.Ar, Oc.S/BS%, and serum osteocalcin levels (E), and 3D μCT images of proximal tibia, with quantification of BV/TV% and Ct. Th. (F) 4 weeks post vehicle/C. rodentium inoculation in WT mice with or without weekly intravenous injections of TNFα neutralizing antibody. Scale bar, 1 mm. (G) Disease activity index [DAI] score during the course of a noninfectious colitis inducing chemical dextran sodium sulfate (DSS; 2 weeks), and following recovery period of 6 weeks. (H) 3D μCT images of proximal tibia, with quantification of BV/TV% and Ct.Th. at 2 and 8 weeks in the DSS-induced colitis model. Scale bar, 1 mm. (I) Serum TNFα levels at 2 and 8 weeks in vehicle [V] or DSS [D] challenged mice in DSS-induced colitis model. (J) Histological analysis of lumbar 4 vertebra, with quantification of BV/TV%, 3 weeks post vehicle/DSS administration in WT mice with or without weekly intravenous injections of TNFα neutralizing antibody. Values are mean ± SEM. n for each group is indicated within each panel. ∗p < 0.05; ∗∗p < 0.01.

References

    1. Martinson J.N.V., Walk S.T. Escherichia coli Residency in the Gut of Healthy Human Adults. EcoSal Plus. 2020;9:1–19. doi: 10.1128/ecosalplus.ESP-0003-2020. - DOI - PMC - PubMed
    1. Nataro J.P., Kaper J.B. Diarrheagenic Escherichia coli. Clin. Microbiol. Rev. 1998;11:142–201. - PMC - PubMed
    1. Ikuta K.S., Swetschinski L.R., Robles Aguilar G., Sharara F., Mestrovic T., Gray A.P., Davis Weaver N., Wool E.E., Han C., Gershberg Hayoon A., et al. Global mortality associated with 33 bacterial pathogens in 2019: a systematic analysis for the Global Burden of Disease Study 2019. Lancet. 2022;400:2221–2248. doi: 10.1016/S0140-6736(22)02185-7. - DOI - PMC - PubMed
    1. Ramakrishna B.S. Prevalence of intestinal pathogens in HIV patients with diarrhea: implications for treatment. Indian J. Pediatr. 1999;66:85–91. doi: 10.1007/BF02752359. - DOI - PubMed
    1. Borenshtein D., McBee M.E., Schauer D.B. Utility of the Citrobacter rodentium infection model in laboratory mice. Curr. Opin. Gastroenterol. 2008;24:32–37. doi: 10.1097/MOG.0b013e3282f2b0fb. - DOI - PubMed