. 2025 Feb 17;6(3):e70104.
doi: 10.1002/mco2.70104. eCollection 2025 Mar.

Early-life antibiotic exposure aggravates hepatic steatosis through enhanced endotoxemia and lipotoxic effects driven by gut Parabacteroides

Affiliations

Early-life antibiotic exposure aggravates hepatic steatosis through enhanced endotoxemia and lipotoxic effects driven by gut Parabacteroides

Xi Zhang et al. MedComm (2020). .

Abstract

Compelling evidence supports a link between early-life gut microbiota and the metabolic outcomes in later life. Using an early-life antibiotic exposure model in BALB/c mice, we investigated the life-course impact of prenatal and/or postnatal antibiotic exposures on the gut microbiome of offspring and the development of metabolic dysfunction-associated steatotic liver disease (MASLD). Compared to prenatal antibiotic exposure alone, postnatal antibiotic exposure more profoundly affected gut microbiota development and succession, which led to aggravated endotoxemia and metabolic dysfunctions. This was primarily resulted from the overblooming of gut Parabacteroides and hepatic accumulation of cytotoxic lysophosphatidyl cholines (LPCs), which acted in conjunction with LPS derived from Parabacteroides distasonis (LPS_PA) to induce cholesterol metabolic dysregulations, endoplasmic reticulum (ER) stress and apoptosis. Integrated serum metabolomics, hepatic lipidomics and transcriptomics revealed enhanced glycerophospholipid hydrolysis and LPC production in association with the upregulation of PLA2G10, the gene controlling the expression of the group X secretory Phospholipase A2s (sPLA2-X). Taken together, our results show microbial modulations on the systemic MASLD pathogenesis and hepatocellular lipotoxicity pathways following early-life antibiotic exposure, hence help inform refined clinical practices to avoid any prolonged maternal antibiotic administration in early life and potential gut microbiota-targeted intervention strategies.

Keywords: antibiotics; early life; gut microbiota; lipotoxicity; metabolic dysfunction‐associated steatotic liver disease.


Conflict of interest statement

F.K.L.C. is Board Member of CUHK Medical Centre. He is a cofounder, nonexecutive Board Chairman and shareholder of GenieBiome Ltd. He receives patent royalties through his affiliated institutions. He has received fees as an advisor and honoraria as a speaker for Eisai Co. Ltd., AstraZeneca, Pfizer Inc., Takeda Pharmaceutical Co., and Takeda (China) Holdings Co. Ltd. S.C.N. has served as an advisory board member for Pfizer, Ferring, Janssen, and Abbvie and received honoraria as a speaker for Ferring, Tillotts, Menarini, Janssen, Abbvie, and Takeda. S.C.N. has received research grants through her affiliated institutions from Olympus, Ferring, and Abbvie. S.C.N. is a scientific co‐founder and shareholder of GenieBiome Ltd. S.C.N. receives patent royalties through her affiliated institutions. F.K.L.C., S.C.N., H.M.T. are named inventors of patent applications held by The CUHK and MagIC that cover the therapeutic and diagnostic use of microbiome but have no potential relevant financial or nonfinancial interests to disclose. The other authors have no conflicts of interest to declare.

Figures

FIGURE 1
FIGURE 1
Schematic overview of study design. Assigned female BALB/c mice were exposed to Penicillin V via drinking water at 0.25 mg/mL in their late pregnancy (the last week prior to laboring), late lactation period (the last week prior to weaning), or during both the pregnancy and breastfeeding period. Pups were weaned at Day 21 and retained males were then assigned into 4 groups according to their early‐life antibiotic exposure status. All groups of pups underwent a 10%  kcal fat standard chow diet period for 5 weeks, then shifted to a 45%  kcal fat high‐fat diet until the end of the experiment. Fecal samples were collected from each dam before and after antibiotic administration during pregnancy and the lactation period, and from each pup during the breastfeeding, chow diet, and high‐fat diet periods for gut microbiota profiling analysis. All the mice were sacrificed at the endpoint for tissue collection. LPS, lipopolysaccharides; LPC, lysophosphatidyl choline.
FIGURE 2
FIGURE 2
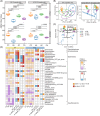
Intergenerational microbiota transfer fidelities varied in mice with prenatal and/or postnatal antibiotic exposure. (A) Intergenerational distribution and expression of each bacteria taxa. Each pup and dam were paired up to identify the number of shared bacterial taxa and their abundances. The heatmap squares were generated based on the average abundance of taxa from 16S rRNA microbiome profiling. The size of the circle is proportional to the number of dam‐pup pairs with intergenerational transfer of the respective taxa. (B) The number of shared taxa among paired dams and pups. (C) Bray–Curtis distance calculated by grouping all dams and pups under each treatment together (left panel) and pairing each dam and pup for matched comparison (right panel). Data point collected during breastfeeding (when pups reached 3 weeks) were used for analysis. The number of dam‐pup dyads for CC, AA, AC, CA group was 6, 5, 6, 6, respectively. p value was calculated by a Wilcoxon's rank‐sum test. AA, pups born by dams with prenatal and postnatal antibiotic exposure; AC, pups born by dams with only prenatal antibiotic exposure; CA, pups born by dams with only postnatal antibiotic exposure; CC, pups born by dams without antibiotic exposure.
FIGURE 3
FIGURE 3
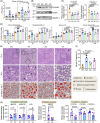
Prenatal and/or postnatal antibiotic exposure altered the gut microbiome composition and diversity in offspring mice. (A) α‐diversity of the gut flora of pups was calculated by Chao1 and Observe. (B, C) Principal coordinates analysis (PCoA) (B) and Canonical correlation analysis (C) showing the similarities in the gut microbiome community structures among pups. (D) Linear discriminant analysis effect size (LEfSe) showing the bacterial taxa altered by early‐life antibiotic exposure under dietary effects. The relative abundance of each taxon was graphed in the heatmap. We considered taxa with linear discriminant analysis (LDA) > 2 and p < 0.05 to be significant. The most significantly representative taxa were marked with blue (more abundant in CC) or red (more abundant in AA or CA). The number of pups within CC, AA, AC, CA group was 6, 5, 6, 6, respectively. BF samples were collected when pups were 3 weeks old; CD samples were collected when pups were 7 weeks old; HFD samples were collected when pups were 23 weeks old. BF, breastfeeding period; CD, chow diet period; HFD, high‐fat diet period.
FIGURE 4
FIGURE 4
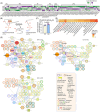
Postnatal antibiotic exposure aggravated the metabolic dysfunction in HFD‐fed mice. (A) Serum LPS level of pups before (during breastfeeding (BF)) and after HFD treatment. Data represented as mean ± SEM, n = 5, one‐way ANOVA. (B, C) Western blot image (B) and protein density quantification (C) of BALB/c pups’ ileal tight junction protein expression after HFD treatment. The abundance of occludin and claudin‐1 in each sample (C) was quantified relative to β‐actin in western blot images by ImageJ. Data represented as mean ± SEM, n = 3, one‐way ANOVA. (D) Serum total cholesterol, triglyceride, low‐density lipoprotein cholesterol (LDL‐C), and cholesterol/high‐density lipoprotein cholesterol (HDL‐C) ratios. Data represented as mean ± SEM, n = 5, one‐way ANOVA. (E) Representative H&E and ORO staining of the mice liver after HFD treatment. (F) Hepatic lipid deposition represented by the percentage of ORO positive‐stained area as quantified by ImageJ. Data represented as mean ± SEM, based on 3 images for each group, one‐way ANOVA. (G) The relative abundance of hepatic genes regulating cholesterol synthesis (HMGCR, HMGCS1, LSS), cholesterol export (ABCG1), and cholesterol utilization (CYP7A1, CYP7B1, CYP27A1) in CC and AA group after HFD treatment. Data represented as mean ± SEM, n = 5, Student’ s t‐test was used to determine significant differences for each gene. BF samples were collected when pups were 3 weeks old; HFD samples were collected when pups were 23 weeks old.
FIGURE 5
FIGURE 5
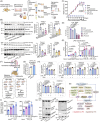
The multiomic interactive networks revealed Parabacteroides‐modulated glycerophospholipid metabolism and the cytotoxic effect of lysophosphatidyl choline (LPC). (A) Differentially expressed lipids [abundance ratio < 0.66 or > 1.2, and variable importance in projection (VIP) > 1]. Statistical significance was determined with two‐way ANOVA, n = 5, *p‐value  <  0.05, **p‐value  <  0.01. (B) A simplified presentation of the action of PLA2 cascade. PLA2 enzymes catalyze the hydrolysis of the sn‐2 ester bond in glycerophospholipids to produce free fatty acids and lysophospholipids. (C) Colonic expression of PLA2G10, a gene encoding group X secretory PLA2 (sPLA2‐X), in mice after HFD treatment (23 weeks old). (D) Heatmap showing the relative abundance of all the fatty acids identified through serum metabolomics. The graph was made based on the mean value (n = 3) of the measured abundance for each metabolite. (E) Networks profiling of the Parabacteroides‐associated lipid‐gene regulation. Differentially expressed (DE) LPCs (squares) that were also closely correlated with Parabacteroides were mapped to genes (circles) to draw an individual functional network showing the perturbations caused by different antibiotic exposures. All the interactions with LPC (22:0) were highlighted by an enlarged nodes and thick purple edges, while those interactions failing to show simultaneous co‐expression patterns with the respective fatty acids were hidden. The sizes of all the nodes are proportional to the number of interactions within each individual network. The color of the circle's outline was mapped to the biological pathways of the genes according to KEGG pathway. Gray edges indicate the associations between LPCs and genes. The edge thickness was drawn based on the value of the correlation coefficient. Blue edges indicated the regulatory paths between genes, which were derived from the literature. All the lipid, metabolite and gene abundance were obtained from pup mice after HFD treatment (23 weeks old).
FIGURE 6
FIGURE 6
Parabacteroides‐induced gut barrier damage and LPS release led to hepatocellular apoptosis and the perturbation of cholesterol metabolic pathways in vitro. (A) Schematic overview of the experiments examining the functional components of Parabacteroides that affect gut barrier function and LPS release. (B) Western blot images and protein density quantification of tight junction proteins of HRT18 cells exposed to conditioned medium (Mock), PA supernatant filtrate, heat‐inactivated PA (upper panels), and LPS extracted from E. coli and PA (lower panels). The protein intensity was quantified by ImageJ. The normalized ratio was labeled above the respective band and was used for the quantification of occludin and claudin‐1 relative to β‐actin. Data represented as mean ± SEM, n = 3, one‐way ANOVA. (C, D) PA components‐induced integrity change measured by TEER. The final resistance values are expressed as: TEER = (RRb ) × A, where R is the measured resistance of the cells, Rb is the resistance of the media blank control (no cells), and A is the area of the filter (1.12 cm2). (E) LPS translocation measured by the amount of LPS in the basal compartment. Cells treated with 20% of conditioned medium or DMSO served as mock controls. (F) Graphical presentation of the metabolic dysfunctions and hepatocellular lipotoxicity modulated by Parabacteroides through the gut‐liver axis. Huh7 cells were treated with DMSO, LPS_PA (50 ng/mL), LPC (22:0) (50 ng/mL), or a combination of LPS and LPC (50 ng/mL vs. 50 ng/mL) for 24 h and harvested to measure the changes of gene markers of cholesterol metabolic pathways and cell death pathways. (G) The expression of PLA2G10, a gene encoding sPLA2‐X in HRT18 cells with or without LPS_PA treatment. Data represented as mean ± SEM, n = 4, Student's t‐test. (H) Expression of gene markers in cholesterol synthesis (HMGCR, HMGCS1, LSS), export (ABCG1) and utilization (CYP7B1, CYP27A1) pathways in Huh7 cells treated with DMSO, LPS_PA (50 ng/mL), LPC (22:0) (50 ng/mL), or a combination of LPS and LPC (50 ng/mL vs. 50 ng/mL). Data represented as mean ± SEM, n = 4, one‐way ANOVA. (I) Caspase cleavage induced by LPS_PA and LPC (22:0). Data represented as mean ± SEM, n = 4, one‐way ANOVA. (J) Western blot images showing the activation of ER stress (ATF6 cleavage and Hsp90b1 upregulation), and apoptosis (phosphorylation of p38 and caspase 3 cleavage) in Huh7 cells treated with DMSO, LPS_PA (50 ng/mL) or LPC (22:0) (50 ng/mL). (K) Schematic diagram showing the two pathogenic processes of MASLD. Endotoxemia and the accumulation of cytotoxic lipids including LPC dysregulate the synthesis, export and utilization of cholesterol, and trigger ER stress and apoptosis following the primary lipid accumulation in liver. PA, Parabacteroides distasonis; TEER, transepithelial electrical resistance. Icons from (A) and (F) were made using BioIcons.

References

    1. Mueller NT, Bakacs E, Combellick J, Grigoryan Z, Dominguez‐Bello MG. The infant microbiome development: mom matters. Trends Mol Med. 2015;21(2):109‐117. - PMC - PubMed
    1. Rautava S, Luoto R, Salminen S, Isolauri E. Microbial contact during pregnancy, intestinal colonization and human disease. Nat Rev Gastroenterol Hepatol. 2012;9(12):565‐576. - PubMed
    1. Koenig JE, Spor A, Scalfone N, et al. Succession of microbial consortia in the developing infant gut microbiome. Proc Natl Acad Sci U S A. 2011;108(Suppl 1):4578‐4585. - PMC - PubMed
    1. Mueller NT, Whyatt R, Hoepner L, et al. Prenatal exposure to antibiotics, cesarean section and risk of childhood obesity. Int J Obes (Lond). 2015;39(4):665‐670. 10.1038/ijo.2014.180 - DOI - PMC - PubMed
    1. Palmer C, Bik EM, DiGiulio DB, Relman DA, Brown PO. Development of the human infant intestinal microbiota. PLoS Biol. 2007;5(7):e177. - PMC - PubMed

LinkOut - more resources