. 2025 Feb 17;6(3):e70075.
doi: 10.1002/mco2.70075. eCollection 2025 Mar.

Histidine triad nucleotide-binding protein 2 attenuates doxorubicin-induced cardiotoxicity through restoring lysosomal function and promoting autophagy in mice

Affiliations

Histidine triad nucleotide-binding protein 2 attenuates doxorubicin-induced cardiotoxicity through restoring lysosomal function and promoting autophagy in mice

Hao Jiang et al. MedComm (2020). .

Abstract

Doxorubicin (DOX) is an effective chemotherapy drug widely used against various cancers but is limited by severe cardiotoxicity. Mitochondria-lysosome interactions are crucial for cellular homeostasis. This study investigates the role of histidine triad nucleotide-binding protein 2 (HINT2) in DOX-induced cardiotoxicity (DIC). We found that HINT2 expression was significantly upregulated in the hearts of DOX-treated mice. Cardiac-specific Hint2 knockout mice exhibited significantly worse cardiac dysfunction, impaired autophagic flux, and lysosomal dysfunction after DOX treatment. Mechanistically, HINT2 deficiency reduced oxidative phosphorylation complex I activity and disrupted the nicotinamide adenine dinucleotide NAD+/NADH ratio, impairing lysosomal function. Further, HINT2 deficiency suppressed sterol regulatory element binding protein 2 activity, downregulating transcription factor A mitochondrial, a critical regulator of complex I. Nicotinamide mononucleotide (NMN) supplementation restored lysosomal function in vitro, while cardiac-specific Hint2 overexpression using adeno-associated virus 9 or adenovirus alleviated DIC both in vivo and in vitro. These findings highlight HINT2 as a key cardioprotective factor that mitigates DIC by restoring the NAD+/NADH ratio, lysosomal function, and autophagy. Therapeutic strategies enhancing HINT2 expression or supplementing NMN may reduce cardiac damage and heart failure caused by DOX.

Keywords: HINT2; NAD+/NADH; autophagy; doxorubicin; lysosome.


Conflict of interest statement

The authors declare no conflicts of interest.

Figures

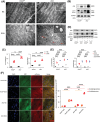
FIGURE 1
FIGURE 1
HINT2 is upregulated in hearts of mice after DOX treatment and HINT2 deficiency exacerbates the heart function of mice after DOX treatment. (A) Heatmap of the 21 proteins that significantly changed in heart samples, as analyzed by mass spectrometry (7 days after 15 mg/kg DOX, i.p., single injection, = 3 mice/group). (B) Representative gel blots and quantification showing levels of HINT2 in heart samples (7 days after 15 mg/kg DOX, i.p., single injection, = 6 mice/group). (C) Time course of representative gel blots and quantification showing levels of HINT2 in AMCMs (= 4 wells/group). (D) Quantification of mRNA expression of Hint2 of hiPSC‐CMs after DOX treatment (1 µM, 4 h) (= 6 wells/group). (E) quantification showing levels of HINT2 fluorescence intensity of hiPSC‐CMs after DOX treatment (= 6 samples/group). (F, G, and H) Quantification of HW/TL (= 8–11 mice/group), EF and FS (= 8–12 mice/group) of mice at 7th day. (I and J) Quantification of mRNA expression of Anp and Bnp of mice heart samples at 7th day (= 6 mice/group). (K) Representative images and quantification of heart sections from mice were stained with WGA to demarcate the cell boundaries (= 6 mice/group). (L) Representative images and quantification of TUNEL staining of heart samples from mice (= 4 mice/group). Data are mean ± SEM. *p < 0.05, **p < 0.01, ***p < 0.001, ****p < 0.0001. p Values are calculated by unpaired Student's t‐test or two‐way ANOVA followed by Tukey's multiple comparisons test.
FIGURE 2
FIGURE 2
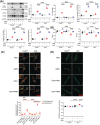
HINT2 deficiency impairs autophagic flux after DOX treatment. (A) Representative images of heart samples by TEM in (×1400) magnification (red arrows indicate autophagosome or autolysosome). (B and C) Representative gel blots and quantification showing levels of LC3‐II and P62 in heart samples from mice (7 days after 15 mg/kg DOX, i.p., single injection, = 6 mice/group). (D and E) Representative gel blots and quantification showing levels of LC3‐II and P62 in heart samples from mice (7 days after 15 mg/kg DOX, i.p., single injection; BAF 1.5 mg/kg was injected intraperitoneally 2 h before death, = 6 mice/group). (F) Representative images of AAV9–mCherry–GFP–LC3 puncta in the heart tissue of mice and quantification of average number of autophagosomes (yellow dots) and autolysosomes (red dots) (= 6 mice/group, each value is the mean of 6 high‐power fields from each mouse). Data are mean ± SEM. *p < 0.05, **p < 0.01, ***p < 0.001. p Values are calculated by two‐way ANOVA followed by Tukey's multiple comparisons test.
FIGURE 3
FIGURE 3
HINT2 deficiency impairs lysosome function after DOX treatment and HINT2 overexpression restores autophagy flux. (A) Representative gel blots and quantification showing levels of pro‐CTSD, CTSD, and CTSB in heart samples from mice (7 days after 15 mg/kg DOX, i.p., single injection, = 6 mice/group). (B and C) Quantification of activity of CTSD and CTSB in heart samples from mice (7 days after 15 mg/kg DOX, i.p., single injection, = 6 mice/group). (D) Representative images of AMCMs after DOX treatment (1 µM, 4 h) stained with LysoSensor Yellow/Blue DND‐160 and quantification. AMCMs were stained with LysoSensor Yellow/Blue DND‐160 (10 µM) for 20 min and detected with a plate reader at the excited fluorescence signal 340 and 380 nm (= 10 wells from three independent experiments). (E) Quantification of DQ‐BSA hydrolysis rate of AMCMs loaded with bovine serum albumin labeled with a green BODIPY dye (= 20 wells/group). (F) Representative gel blots and quantification showing levels of LC3‐II and P62 in AMCMs infected with AdCon or AdHint2 after PBS or DOX treatment (1 µM, 4 h), with or without BAF treatment (100 nM, 4 h before harvest, = 6 wells/group). Data are mean ± SEM. *p < 0.05, **p < 0.01, ***p < 0.001. p Values are calculated by two‐way ANOVA followed by Tukey's multiple comparisons test.
FIGURE 4
FIGURE 4
HINT2 deficiency impairs OXPHOS complex Ι and downregulates ratio of NAD+/NADH. (A and B) GO analysis and KEGG analysis of differentially expressed protein in heart samples from mice (7 days after 15 mg/kg DOX, i.p., single injection, 3 mice/group). (C) Representative gel blots and quantification showing levels of OXPHOS complexes Ι–V in heart samples from mice (7 days after 15 mg/kg DOX, i.p., single injection, = 6 mice/group). (D) Quantification of mRNA levels of mtND1 and mtND6 of mice heart samples (7 days after 15 mg/kg DOX, i.p., single injection, = 6 mice/group). (E) Quantification of activity of OXPHOS complex Ι in heart samples from mice (7 days after 15mg/kg DOX, i.p., single injection, = 10 mice/group). (F) Quantification of ratio of NAD+/NADH in AMCMs after DOX treatment (1 µM, 4 h) (= 5 wells/group). Data are mean ± SEM. *p < 0.05, **p < 0.01, ***p < 0.001. p Values are calculated by two‐way ANOVA followed by Tukey's multiple comparisons test.
FIGURE 5
FIGURE 5
NMN could restore the autophagy flux in cKO mice treated with DOX. (A) Representative gel blots and quantification showing levels of LC3‐II, P62, pro‐CTSD, CTSD, and CTSB in heart samples from mice (= 6 mice/group). (B) Quantification of EF and FS of mice (= 6 mice/group). (C) Representative images of mCherry–GFP–LC3 puncta in the AMCMs and average number of autophagosomes (yellow dots) and autolysosomes (red dots) per cell after DOX treatment (1 µM, 4 h) with or without NMN replenishment (= 6 samples/group, each value is the mean of six cells from each well). (D) Representative images and quantification of AMCMs stained with LysoSensor Yellow/Blue DND‐160 after DOX treatment (1 µM, 4 h) with or without NMN replenishment. AMCMs were stained with LysoSensor Yellow/Blue DND‐160 (10 µM) for 20 min and detected with a plate reader at the excited fluorescence signal 340 and 380 nm (= 6 wells from three independent experiments). Data are mean ± SEM. *p < 0.05, **p < 0.01, ***p < 0.001. p Values are calculated by two‐way ANOVA followed by Tukey's multiple comparisons test.
FIGURE 6
FIGURE 6
HINT2 deficiency downregulates TFAM expression and TFAM overexpression could restore cardiac dysfunction caused by HINT2 deficiency. (A) Representative gel blots and quantification showing levels of TFAM in heart samples from mice (= 6 mice/group). (B) Quantification of mRNA levels of TFAM of mice heart samples (= 6 mice/group). (C) Representative gel blots and quantification showing levels of TFAM in heart samples from mice (= 6 mice/group). (D) Quantification of EF and FS of Hint2fl/fl and cKO mice injected with AAVCon or AAVTFAM at 7 days after NS or DOX treatment (= 6 mice/group). Data are mean ± SEM. *p < 0.05, **p < 0.01, ***p < 0.001. p Values are calculated by two‐way ANOVA followed by Tukey's multiple comparisons test.
FIGURE 7
FIGURE 7
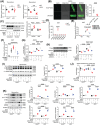
HINT2 deficiency cause cholesterol accumulation and decreases SREBF2 nuclear translocation which impairs TFAM transcription. A Quantification of cholesterol level of heart samples from mice (= 6 mice/group). (B) Representative images and quantification of SREBF2 immunofluorescence analysis in AMCMs following DOX treatment (1 µM, 4 h) (= 6 samples/group). (C) Representative gel blots and quantification showing levels of SREBF2 translocation in AMCMs from model mice (= 6 mice/group). (D) ChIP analysis of SREBF2 at seven positions of TFAM promoter in HEK293T cells (= 4 /group). (E) ChIP assays of SREBF2 binding to the TFAM promoter in HEK293T transfected with siCon or siHint2 and treated with or without DOX (1 µM, 4 h) (= 3 wells/group). (F) Dual luciferase report assay used to detect TFAM promoter activity in HEK293T cells (= 6 wells/group). (G) Quantification of mRNA levels of TFAM in AMCMs (DOX, 1 µM, 4 h; Fatostatin, 1 µM, 24 h) (= 6 wells/group). (H) Representative gel blots and quantification showing levels of TFAM in AMCMs (DOX, 1 µM, 4 h; Fatostatin, 1 µM, 24 h) (= 6 wells/group). (I and K) Representative gel blots and quantification showing levels of OXPHOS complexes Ι–V, LC3‐II, P62, pro‐CTSD, CTSD, and CTSB in heart samples from mice (= 6 mice/group). (J) Quantification of ratio of NAD+/NADH in AMCMs from model mice after DOX treatment (1 µM, 4 h) (= 6 mice/group). Data are mean ± SEM. *p < 0.05, **p < 0.01, ***p < 0.001. p Values are calculated by unpaired Student's t test or two‐way ANOVA followed by Tukey's multiple comparisons test.
FIGURE 8
FIGURE 8
Cardiac specific overexpression of HINT2 attenuates DIC. (A) Representative gel blots and quantification showing levels of HINT2 in heart samples from mice (= 6 mice/group). (B, C, and D) Quantification of EF, FS (= 8 mice/group) and HW/TL (= 6 mice/group) of mice. (E and F) Quantification of mRNA expression of Anp and Bnp of heart samples from mice (= 6 mice/group). (G) Representative images and quantification of heart sections from mice were stained with WGA to demarcate the cell boundaries (= 6 mice/group). (H) Representative images and quantification of TUNEL staining of heart samples from mice (= 6 mice/group). (I) Representative gel blots and quantification showing levels of cleaved caspase 3 in heart samples from mice (= 6 mice/group). (J) Proposed model of how HINT2 deficiency aggravates DIC. Data are mean ± SEM. *p < 0.05, **p < 0.01, ***p < 0.001. p Values are calculated by two‐way ANOVA followed by Tukey's multiple comparisons test.

References

    1. Barry E, Alvarez JA, Scully RE, Miller TL, Lipshultz SE. Anthracycline‐induced cardiotoxicity: course, pathophysiology, prevention and management. Expert Opin Pharmacother. 2007;8(8):1039‐1058. - PubMed
    1. Vasquez‐Vivar J, Martasek P, Hogg N, Masters BS, Pritchard KA, Jr , Kalyanaraman B. Endothelial nitric oxide synthase‐dependent superoxide generation from adriamycin. Biochemistry. 1997;36(38):11293‐11297. - PubMed
    1. Berthiaume JM, Wallace KB. Adriamycin‐induced oxidative mitochondrial cardiotoxicity. Cell Biol Toxicol. 2007;23(1):15‐25. - PubMed
    1. de Baat EC, Mulder RL, Armenian S, et al. Dexrazoxane for preventing or reducing cardiotoxicity in adults and children with cancer receiving anthracyclines. Cochrane Database Syst Rev. 2022;9(9):CD014638. - PMC - PubMed
    1. Hasinoff BB, Schnabl KL, Marusak RA, Patel D, Huebner E. Dexrazoxane (ICRF‐187) protects cardiac myocytes against doxorubicin by preventing damage to mitochondria. Cardiovasc Toxicol. 2003;3(2):89‐99. - PubMed

LinkOut - more resources