. 2025 Mar;34(3):e70071.
doi: 10.1002/pro.70071.

Insights into the low-temperature adaptation of an enzyme as studied through ancestral sequence reconstruction

Affiliations

Insights into the low-temperature adaptation of an enzyme as studied through ancestral sequence reconstruction

Shuang Cui et al. Protein Sci. 2025 Mar.

Abstract

For billions of years, enzymes have evolved in response to the changing environments in which their host organisms lived. Various lines of evidence suggest the earliest primitive organisms inhabited high-temperature environments and possessed enzymes adapted to such conditions. Consequently, extant mesophilic and psychrophilic enzymes are believed to have adapted to lower temperatures during the evolutionary process. Herein, we analyzed this low-temperature adaptation using ancestral sequence reconstruction. Previously, we generated the phylogenetic tree of 3-isopropylmalate dehydrogenases (IPMDHs) and reconstructed the sequence of the last bacterial common ancestor. The corresponding ancestral enzyme displayed high thermostability and catalytic activity at elevated temperatures but moderate activity at low temperatures (Furukawa et al., Sci. Rep., 2020;10:15493). Here, to identify amino acid residues that are responsible for the low-temperature adaptation, we reconstructed and characterized all 11 evolutionary intermediates that sequentially connect the last bacterial common ancestor with extant mesophilic IPMDH from Escherichia coli. A remarkable change in catalytic properties, from those suited for high reaction temperatures to those adapted for low temperatures, occurred between two consecutive evolutionary intermediates. Using a combination of sequence comparisons between ancestral proteins and site-directed mutagenesis analyses, three key amino acid substitutions were identified that enhance low-temperature catalytic activity. Intriguingly, amino acid substitutions that had the most significant impact on activity at low temperatures displayed no discernable effect on thermostability. However, these substitutions markedly reduced the activation energy for catalysis, thereby improving low-temperature activity. The results were further investigated by molecular dynamics simulations of the predicted structures of the ancestral enzymes. Our findings exemplify how ancestral sequence reconstruction can identify residues crucial for adaptation to low temperatures.

Keywords: activation energy; ancestral sequence reconstruction; low‐temperature activity; low‐temperature adaptation; thermostability.


Conflict of interest statement

The authors declare no conflicts of interest.

Figures

FIGURE 1
FIGURE 1
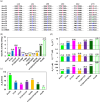
Characterization of ancestral IPMDHs reconstructed in this study. (a) Schematic representation of the trajectory within the phylogenetic tree of IPMDH connecting the oldest ancestor (Anc01) with E. coli IPMDH via 10 intermediate nodes (Anc02–Anc11). Anc05 is the divergence point between the hyperthermophilic T. maritima and the mesophilic E. coli IPMDHs. (b) T ms of the ancestral and E. coli IPMDHs. The T m values were estimated from the data shown in Figure S3. The numerical T m values are shown in Table S1. (c) Specific activities of the ancestral and E. coli IPMDHs at 25°C. The vertical axis uses a logarithmic scale. Each value is the average of three measurements. The error bars represent the standard errors. (d) E as of the ancestral and E. coli IPMDHs. The E a values were estimated from the slopes of the Arrhenius plots shown in Figure S4b. The numerical E a values are given in Table S1.
FIGURE 2
FIGURE 2
Kinetic parameters of ancestral IPMDHs and EcIPMDH at 25°C. k cat, KmD3IPM, KmNAD, and standard errors were calculated by nonlinear least‐square fitting of the steady‐state kinetic data to the Michaelis–Menten equation using the Enzyme Kinetics module of SigmaPlot Ver. 14.5 (Systat Software). The vertical axes are shown with a logarithmic scale. The numerical values are given in Table S1.
FIGURE 3
FIGURE 3
Characterization of the mutants of Anc05. (a) Six mutations that occurred between Anc05 and Anc06. (b) Specific activities of Anc05, its mutants, and Anc06 at 25°C. Each value is the average of three measurements. The error bars represent the standard errors. Values relative to that of Anc05 are given in parentheses above the bars. (c) E as of Anc05, its mutants, and Anc06. Numerical values are shown above the bars. The E a values were estimated from the slopes of the Arrhenius plots given in Figure S9b. (d) Kinetic parameters of Anc05, its mutants, and Anc06 at 25°C. k cat, KmD3IPM, KmNAD, and standard errors were calculated by nonlinear least‐square fitting of the steady‐state kinetic data to the Michaelis–Menten equation using the Enzyme Kinetics module of SigmaPlot Ver. 14.5 (Systat Software). The vertical axes are shown with a logarithmic scale. Values relative to that of Anc05 are shown in parentheses above the bars. The numerical values are given in Table S1.
FIGURE 4
FIGURE 4
A modeled dimeric structure of Anc05 predicted using Alphafold2 (Jumper et al. 2021). The subunits of the proteins are each colored differently. Each subunit is divided into two structural domains; domain 1 includes the N‐ and C‐termini, and domain 2 includes the subunit interface. Residues at positions 112, 131, 15, 190, 242, and 270 in each subunit are highlighted. The side chains of residues 112 and 131 interact with each other, and the side chains of residues 190 and 242 also interact. Residues 112 and 270 are each located at a terminus of a β‐strand connecting the two domains.
FIGURE 5
FIGURE 5
Characterization of the V128F mutants of Anc01 and Anc03. (a) Specific activities of Anc01, Anc03, and their mutants at 25°C. Numerical values are shown above the bars. Each value is the average of three measurements. The error bars represent the standard errors. (b) E as of Anc01, Anc03, and their mutants. Numerical values are shown above the bars. The E a values were estimated from the slopes of the Arrhenius plots given in Figure S10b. (c) Temperature‐induced unfolding curves of Anc03 and its V128F mutant. The change in ellipticity at 222 nm was monitored as a function of temperature. The temperature was increased at a rate of 1.0°C/min. The samples comprised 5.0 μM protein in 20 mM potassium phosphate (pH 7.6), 0.5 mM EDTA. Each experiment was performed in duplicate with identical unfolding curves within experimental error. The plots were normalized with respect to the baseline of the native and denatured states.

References

    1. Akanuma S, Bessho M, Kimura H, Furukawa R, Yokobori SI, Yamagishi A. Establishment of mesophilic‐like catalytic properties in a thermophilic enzyme without affecting its thermal stability. Sci Rep. 2019;9:9346. - PMC - PubMed
    1. Akanuma S, Nakajima Y, Yokobori S, Kimura M, Nemoto N, Mase T, et al. Experimental evidence for the thermophilicity of ancestral life. Proc Natl Acad Sci U S A. 2013;110:11067–11072. - PMC - PubMed
    1. Bjelic S, Brandsdal BO, Aqvist J. Cold adaptation of enzyme reaction rates. Biochemistry. 2008;47:10049–10057. - PubMed
    1. Brooks BR, Brooks CL III, MacKerell AD Jr, Nilsson L, Petrella RJ, Roux B, et al. CHARMM: the biomolecular simulation program. J Comput Chem. 2009;30:1545–1614. - PMC - PubMed
    1. Busch F, Rajendran C, Heyn K, Schlee S, Merkl R, Sterner R. Ancestral tryptophan synthase reveals functional sophistication of primordial enzyme complexes. Cell Chem Biol. 2016;23:709–715. - PubMed

MeSH terms

Substances

LinkOut - more resources