Clinical, Genetic, Imaging and Electrophysiological Findings in a Cohort of Patients With GUCA1A-Associated Retinopathy
- PMID: 39969478
- PMCID: PMC11841689
- DOI: 10.1167/iovs.66.2.50
Clinical, Genetic, Imaging and Electrophysiological Findings in a Cohort of Patients With GUCA1A-Associated Retinopathy
Abstract
Purpose: To report findings in GUCA1A-associated retinopathy, a rare autosomal-dominant retinopathy.
Methods: Clinical features and investigations from molecularly confirmed patients at a large referral center were analyzed (retrospective cohort study).
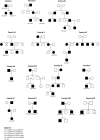
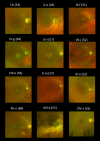
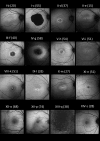
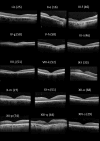
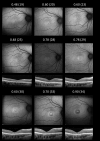
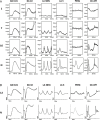
Results: Nineteen patients (14 families), with five different variants, were included: p.(Tyr99Cys) in 10 families and p.(Leu84Phe), p.(Ile107Thr), p.(Glu111Ala), and p.(leu176Phe) in 1 family each. Mean (SD) ages at first and last visits were 38 (17) and 48 (15) years, respectively. Mean (SD) logMAR visual acuities at the first and last visits were 0.67 (0.61) and 0.94 (0.58) for right eyes and 0.63 (0.63) and 0.95 (0.74) for left eyes. Acuities ranged from 0.00 logMAR to no light perception. Most described progressive problems with central and color vision. Across 144 patient visits, logMAR acuity correlated with age (Spearman coefficients of 0.43 and 0.54 for right and left eyes, P < 0.001), with a high interocular correlation (coefficient 0.90, P < 0.001). Optical coherence tomography showed irregularity and then loss of the central ellipsoid zone. Ultra-widefield imaging showed peripheral degeneration in some patients. Electrophysiology (n = 13) was consistent with cone dystrophy (n = 11) or macular dystrophy (n = 2). Compared with the common p.(Tyr99Cys) variant, patients with p.(Glu111Ala) (n = 2) had worse vision; those with p.(Leu84Phe) (n = 3) were younger with earlier-onset visual loss. Patients with p.(Ile107Thr) (n = 2) showed later presentation, with milder acuity reduction.
Conclusions: We present genotypic and phenotypic findings from the largest cohort with GUCA1A retinopathy. Most had progressive visual loss and electrophysiologic evidence of cone dystrophy. Possible genotype-phenotype correlations emerged, but subgroups were small for four of five variants.
Conflict of interest statement
Disclosure:
Figures




Similar articles
-
Best Vitelliform Macular Dystrophy Natural History Study Report 1: Clinical Features and Genetic Findings.Ophthalmology. 2024 Jul;131(7):845-854. doi: 10.1016/j.ophtha.2024.01.027. Epub 2024 Jan 24. Ophthalmology. 2024. PMID: 38278445 Free PMC article.
-
IQCB1 (NPHP5)-Retinopathy: Clinical and Genetic Characterization and Natural History.Am J Ophthalmol. 2024 Aug;264:205-215. doi: 10.1016/j.ajo.2024.03.009. Epub 2024 Mar 23. Am J Ophthalmol. 2024. PMID: 38522724 Free PMC article.
-
Clinical, Genotypic, and Imaging Characterization of the Spectrum of ABCA4 Retinopathies.Ophthalmol Retina. 2024 May;8(5):509-519. doi: 10.1016/j.oret.2023.10.023. Epub 2023 Nov 3. Ophthalmol Retina. 2024. PMID: 37924945
-
DETAILED CLINICAL PHENOTYPING OF OXALATE MACULOPATHY IN PRIMARY HYPEROXALURIA TYPE 1 AND REVIEW OF THE LITERATURE.Retina. 2016 Nov;36(11):2227-2235. doi: 10.1097/IAE.0000000000001058. Retina. 2016. PMID: 27135212 Review.
-
Vitamin A and fish oils for preventing the progression of retinitis pigmentosa.Cochrane Database Syst Rev. 2020 Jun 18;6(6):CD008428. doi: 10.1002/14651858.CD008428.pub3. Cochrane Database Syst Rev. 2020. PMID: 32573764 Free PMC article.
References
-
- Payne AM, Downes SM, Bessant DAR, Taylor R, Holder GE, Warren MJ, et al. .. A mutation in guanylate cyclase activator 1A (GUCA1A) in an autosomal dominant cone dystrophy pedigree mapping to a new locus on chromosome 6p21.1. Hum Mol Genet. 1998; 7(2): 273–277. - PubMed
-
- Michaelides M, Wilkie SE, Jenkins S, et al. .. Mutation in the gene GUCA1A, encoding guanylate cyclase-activating protein 1, causes cone, cone-rod, and macular dystrophy. Ophthalmology. 2005; 112(8): 1442–1447. - PubMed
-
- Downes SM, Holder GE, Fitzke FW, et al. .. Autosomal dominant cone and cone-rod dystrophy with mutations in the guanylate cyclase activator 1A gene-encoding guanylate cyclase activating protein-1. Arch Ophthalmol. 2001; 119(1): 96–105. - PubMed
MeSH terms
Grants and funding
LinkOut - more resources
Full Text Sources
Medical

