. 2025 Feb 19:12:RP93283.
doi: 10.7554/eLife.93283.

Synovial macrophage diversity and activation of M-CSF signaling in post-traumatic osteoarthritis

Affiliations

Synovial macrophage diversity and activation of M-CSF signaling in post-traumatic osteoarthritis

Alexander J Knights et al. Elife. .

Abstract

Synovium is home to immune and stromal cell types that orchestrate inflammation following a joint injury; in particular, macrophages are central protagonists in this process. We sought to define the cellular and temporal dynamics of the synovial immune niche in a mouse model of post-traumatic osteoarthritis (PTOA), and to identify stromal-immune crosstalk mechanisms that coordinate macrophage function and phenotype. We induced PTOA in mice using a non-invasive tibial compression model of anterior cruciate ligament rupture (ACLR). Single-cell RNA-sequencing and flow cytometry were used to assess immune cell populations in healthy (Sham) and injured (7 and 28 days post-ACLR) synovium. Characterization of synovial macrophage polarization states was performed, alongside computational modeling of macrophage differentiation, as well as implicated transcriptional regulators and stromal-immune communication axes. Immune cell types are broadly represented in healthy synovium, but experience drastic expansion and speciation in PTOA, most notably in the macrophage portion. We identified several polarization states of macrophages in synovium following joint injury, underpinned by distinct transcriptomic signatures, and regulated in part by stromal-derived macrophage colony-stimulating factor signaling. The transcription factors Pu.1, Cebpα, Cebpβ, and Jun were predicted to control differentiation of systemically derived monocytes into pro-inflammatory synovial macrophages. In summary, we defined different synovial macrophage subpopulations present in healthy and injured mouse synovium. Nuanced characterization of the distinct functions, origins, and disease kinetics of macrophage subtypes in PTOA will be critical for targeting these highly versatile cells for therapeutic purposes.

Keywords: immunology; inflammation; joint injury; macrophages; mouse; osteoarthritis; single-cell RNA-seq; synovium.


Conflict of interest statement

AK, EF, OE, MS, CA, TM No competing interests declared

Figures

Figure 1.
Figure 1.. Diverse immune cell types are present in healthy and injured synovium.
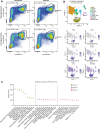
(A) Uniform manifold approximation and projection (UMAP) plot of all immune cells by single-cell RNA sequencing (scRNA-seq) of synovium from mice subjected to Sham, 7 days anterior cruciate ligament rupture (ACLR) and 28 days ACLR, or (B) split by condition. (C) Breakdown of immune cell types by total abundance (left) or proportion (right) in Sham, 7 days ACLR or 28 days ACLR synovium. (D) t-Distributed stochastic neighbor embedding (t-SNE) plot of immune cell types by flow cytometry of CD45+ synovial cells from mice subjected to Sham (left and right synovia from n=4 mice) and 7 days ACLR (right synovia from n=4 mice). (E) t-SNE heatmaps of scatter and surface marker parameters used to define synovial immune cell identities by flow cytometry. Tregs: regulatory T cells; NK cells: natural killer cells; ILC: innate lymphoid cells; DC: dendritic cells; cDC: conventional DCs; MΦ: macrophages; FSC-A: forward scatter area; SSC-A: side scatter area.
Figure 1—figure supplement 1.
Figure 1—figure supplement 1.. Computational subsetting of immune cells from whole synovium single-cell RNA sequencing (scRNA-seq).
(A) Immune cell clusters (2, 5, 8) were computationally subset out of all synovial cells from previously published dataset available at NCBI GEO Accession number GSE211584 (Knights et al., 2023b). (B) Feature plots showing immune or mesenchymal clusters in synovium based on expression of Ptprc (encoding CD45) and Pdgfra, respectively. (C) Violin plots showing marker genes for each immune cell cluster. (D–F) Total abundance and proportion of major immune cell types, and their subgroupings, in synovium from Sham, 7 days anterior cruciate ligament rupture (ACLR) or 28 days ACLR mice.
Figure 2.
Figure 2.. Integration of joint immune cells from mouse arthritis single-cell RNA sequencing (scRNA-seq) datasets.
(A) Integrated uniform manifold approximation and projection (UMAP) plot of all immune cells from GSE134420 (Culemann), GSE200843 (Sebastian), GSE211584 (Knights), and GSE184609 (Muench). (B) Violin plots showing gene markers for each cell cluster. (C) Proportional breakdown of each major immune cell type in each dataset. (D) UMAP plots showing immune cell clusters for each dataset. (E) CellChat outgoing communication patterns for each major immune cell group. Neut: neutrophils; Mono: monocytes; Prolif: proliferating cells.
Figure 2—figure supplement 1.
Figure 2—figure supplement 1.. Recapitulation of published single-cell RNA sequencing (scRNA-seq) datasets: Culemann.
(A) Uniform manifold approximation and projection (UMAP) plot of all cell clusters from GSE134420 (Culemann et al., 2019). Cells were sorted CD45+ CD11b+ Ly6G- hindpaw synovial cells from mice subjected to the K/BxN serum transfer model of rheumatoid arthritis (RA). Clusters are designated as immune or stromal based on the expression of Ptprc (encoding CD45) and Itgam (encoding CD11b) in (B). The stromal cell cluster (6) was removed, and remaining cells (clusters 0–5) were re-clustered to recapitulate the data found in the originating manuscript (C). Marker genes used to describe each cluster in the original dataset are shown as feature plots (D).
Figure 2—figure supplement 2.
Figure 2—figure supplement 2.. Recapitulation of published single-cell RNA sequencing (scRNA-seq) datasets: Sebastian.
(A) Uniform manifold approximation and projection (UMAP) plot of all cell clusters from GSE200843 (Sebastian et al., 2022). Cells were sorted CD45+ cells obtained from a whole knee joint digestion in the anterior cruciate ligament rupture (ACLR) model of mouse post-traumatic osteoarthritis (PTOA). Clusters are designated as immune, erythrocytes, or stromal/vascular based on the expression of Ptprc (encoding CD45), Pdgfra, Pecam1 (encoding CD31), and Hba-a1 (encoding α-globin) in (B). The stromal/vascular and erythrocyte cell clusters (4 and 6) were removed and remaining cells (clusters 0–3, 5) were re-clustered to recapitulate the data found in the originating manuscript (C). Marker genes used to describe major cell types in the original dataset are shown as feature plots (D).
Figure 2—figure supplement 3.
Figure 2—figure supplement 3.. Recapitulation of published single-cell RNA sequencing (scRNA-seq) datasets: Muench.
(A) Uniform manifold approximation and projection (UMAP) plot of all cell clusters from GSE184609 (Muench et al., 2022). Cells were sorted live cells obtained from hindpaw synovia of mice with GPI-induced rheumatoid arthritis (RA). Clusters are designated as immune, stromal, endothelial, glial, mural, muscle, or proliferating, based on the expression of Ptprc (encoding CD45), Pdgfra, Pecam1 (encoding CD31), Mcam (encoding CD146), Acta1 and Top2a in (B). All non-immune cell clusters (1, 3, 10–14, 18–20) were removed and remaining cells (clusters 0, 2, 4–9, 15–17) were re-clustered to recapitulate the data found in the originating manuscript (C). Marker genes used to describe major cell types in the original dataset are shown as feature plots (D).
Figure 2—figure supplement 4.
Figure 2—figure supplement 4.. Integration of immune single-cell RNA sequencing (scRNA-seq) datasets.
(A) Heatmap of top 5 gene markers for each cell cluster in the integrated immune object of all scRNA-seq datasets. (B) Total abundance of each major immune cell grouping for each dataset. (C) Heatmap of outgoing cell patterns for major immune cell groups generated in CellChat (Jin et al., 2021). (D) Outgoing cell signaling pathways that contribute to each pattern in (C).
Figure 2—figure supplement 5.
Figure 2—figure supplement 5.. Assessment of neutrophils in the whole joint.
(A) Healthy mouse knee joints were subjected to two-step digestion described by Leale et al., 2022, resulting in a soft and hard tissue fraction. Joints were taken from naïve mice (unperfused) or mice perfused with 50 mL PBS to clear removing circulating cells from the vasculature. A single female mouse was used per group. Plots of live CD45+ cells are shown, and neutrophils (CD45+ CD11b+ Ly6G+) are gated on. Abundance is shown as a proportion of all CD45+ cells in each sample. (B) Uniform manifold approximation and projection (UMAP) plot of all immune cell clusters from all datasets, showing the three neutrophil (Neut-1, -2, -3) clusters. Feature plots of hallmark neutrophil genes are shown below. (C) Top unique genes (with Log2FC and padj) for the three neutrophil clusters were generated by FindAllMarkers then submitted to Cluster Identity PRedictor (CIPR) (Ekiz et al., 2020) analysis using the ImmGen V1 and V2 datasets, to compare the expression signatures of our three neutrophil clusters to pre-sorted published neutrophil gene signatures. Identity score for each pre-sorted cell type is shown. Also see Supplementary file 2.
Figure 3.
Figure 3.. Comparison of macrophages between arthritis disease states.
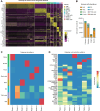
(A) Monocytes and MΦ from all post-traumatic osteoarthritis (PTOA) and rheumatoid arthritis (RA) immune cell datasets were computationally isolated, resulting in three clusters: MΦ, monocytes and osteoclast-like cells. (B) Feature plots showing expression levels of highly enriched genes unique to each cluster. (C) Side-by-side uniform manifold approximation and projection (UMAP) plot of monocytes and MΦ from PTOA and RA datasets and (D) the proportion of each cluster within each disease state. (E) Differential gene expression analyses were performed on the MΦ cluster specifically. Comparison groups were PTOA vs control (Ctrl) MΦ and RA vs control (Ctrl) MΦ, with overlapping and non-overlapping differentially expressed genes (DEGs) for each comparison shown in a Venn diagram. Also see Supplementary files 3 and 4 . (F–G) Enriched biological pathways in PTOA (F) and RA (G) MΦ when compared to their respective control MΦ. (H) Conserved enriched biological pathways between PTOA and RA MΦ, derived from common DEGs with the same directionality between both separate comparisons. Also see Supplementary file 5 . For all pathway analyses, statistical overrepresentation tests were performed with Fisher’s exact testing and calculation of false discovery rate (FDR). GO:BP: Gene Ontology Biological Pathways; GO:MF: Gene Ontology Molecular Function.
Figure 3—figure supplement 1.
Figure 3—figure supplement 1.. Macrophages in osteoarthritis (OA) and rheumatoid arthritis (RA).
(A) Uniform manifold approximation and projection (UMAP) plots showing clusters of MΦ, monocytes, and osteoclast-like cells across datasets.
Figure 3—figure supplement 2.
Figure 3—figure supplement 2.. Outgoing signaling patterns from macrophages in post-traumatic osteoarthritis (PTOA) and rheumatoid arthritis (RA).
(A–B) River plots of outgoing communication patterns of MΦ, monocytes (Mono), and osteoclasts (Osteo) in PTOA (A) or RA (B), generated in CellChat. *Same signals from the same cell type in PTOA and RA. #Same signals but from different cell types in PTOA and RA. $Signals unique to PTOA or RA. (C–D) Top: Heatmaps of outgoing cell patterns for MΦ, monocytes, and osteoclasts in PTOA (C) or RA (D). Bottom: Outgoing cell signaling pathways that contribute to each pattern in PTOA (C) or RA (D).
Figure 4.
Figure 4.. Synovial macrophage subsets and trajectories in post-traumatic osteoarthritis (PTOA).
(A) Uniform manifold approximation and projection (UMAP) plot of monocytes and MΦ from synovium of Sham, 7 days anterior cruciate ligament rupture (ACLR) and 28 days ACLR mice, or split by condition (B). Cluster naming and top gene markers are given on the right. (C) Gene feature plots showing expression of key marker genes for each subset. (D) Pseudotime trajectories overlaid onto monocyte and MΦ subsets showing directionality (arrowheads), starting points (roots, stars), branching points (nodes, black circles), and endpoints (termini, gray circles with black outline). Partitions are shown as disconnected (separate) trajectory trails. Colored cell clusters are shown in the top plot and pseudotime scale is shown in the bottom plot. (E) Heatmaps of top differentially expressed genes (DEGs) in pairwise comparisons for basal resident MΦ, resident-like MΦ A, and resident-like MΦ B clusters (padj<0.05). (F) Enriched biological pathways in basal resident MΦ, resident-like MΦ A, and resident-like MΦ B clusters, derived from statistical overrepresentation tests of DEGs from corresponding pairwise comparisons in (E). Also see Supplementary file 6. Fisher’s exact testing was performed and false discovery rate (FDR) was calculated. GO:BP: Gene Ontology Biological Pathways.
Figure 4—figure supplement 1.
Figure 4—figure supplement 1.. Synovial macrophage subsets and trajectories.
(A) To generate an object containing only monocytes and MΦ from our dataset (GSE211584), we first subset all myeloid cell clusters from Seurat into Monocle3, then removed dendritic cell (DC), mast cells, and granulocytes. (B) Feature plots of classical MΦ/monocyte marker genes, and (C) genes traditionally associated with an M1 or M2 MΦ phenotype. (D) A uniform manifold approximation and projection (UMAP) plot of all MΦ/monocyte clusters and their designations are provided for reference. n.d.: not detected.
Figure 5.
Figure 5.. Stromal-immune crosstalk via M-CSF signaling.
(A) Cartoon depicting multi-directional and uni-directional crosstalk between stromal and immune cells in synovium, used for calculation of crosstalk communication probability scores. (B) Induction ratio for multi-directional and uni-directional M-CSF signaling derived from crosstalk communication probability scores (7 days anterior cruciate ligament rupture [ACLR]/Sham). (C) Expression of M-CSF ligands Csf1 and Il34, and the M-CSF receptor Csf1r, from bulk RNA-seq of Sham, 7 days ACLR, or 28 days ACLR synovium (n=5–6 male and n=5–6 female synovia per condition) (dataset available at NCBI GEO Accession Number GSE271903). (D) CellChat hierarchy plots for the M-CSF signaling pathway in Sham, 7 days ACLR and 28 days ACLR. Circles with fill represent cells sending signals, circles without fill represent cells receiving signals, in each condition. Line thickness corresponds to strength of communication. (E–G) Feature plots showing expression of Csf1 (E), Il34 (F), and Csf1r (G) in all synovial cells, split by condition (Sham, 7 days ACLR, or 28 days ACLR). n/a: not applicable; Fibro: fibroblasts; Peri: pericytes.
Figure 5—figure supplement 1.
Figure 5—figure supplement 1.. Stromal-immune crosstalk communication probability ratios in Sham and 7 days anterior cruciate ligament rupture (ACLR).
(A–C) Crosstalk communication probability ratios for multi-directional (stromal ←→ immune) or uni-directional (stromal → immune or immune → stromal) signaling in Sham synovium. A higher ratio indicates a higher likelihood of signaling activity in the specified crosstalk direction. CSF signaling is highlighted in red. (D–F) As above, but for 7 days ACLR.
Figure 5—figure supplement 2.
Figure 5—figure supplement 2.. M-CSF signaling hierarchy to stromal cells.
(A–C) CellChat hierarchy plots for the M-CSF signaling pathway in Sham, 7 days anterior cruciate ligament rupture (ACLR) and 28 days ACLR, with stromal cells as the receiving cell type in each case. Circles with fill represent cells sending signals, circles without fill represent cells receiving signals, in each condition. No M-CSF signaling was detected in the direction of stromal cells as receivers.
Figure 6.
Figure 6.. Transcriptional control of monocyte differentiation in synovium.
(A–B) Pseudotime trajectory from monocytes to infiltrating MΦ showing directionality (arrowheads), starting point (root, star), branching points (nodes, black circles), and endpoints (termini, gray circles with black outline). Pseudotime scale is shown in (B). (C) Heatmap of gene module analysis of co-regulated genes across pseudotime trajectory from monocytes to infiltrating MΦ. Also see Supplementary file 7. (D) Modules 1, 4, and 6 were subjected to promoter screening for putative transcriptional regulators of module genes, using RcisTarget. Top directly annotated motif hits and their corresponding transcription factors (TFs) are shown. (E) Gene regulatory network for the TFs Pu.1 (Spi1), Jun, Cebpa, and Cebpb. (F) Pseudotime regression plots of selected gene from the gene regulatory network in (E). Monocytes to infiltrating MΦ, left to right.
Figure 6—figure supplement 1.
Figure 6—figure supplement 1.. Expression of key transcription factors across pseudotime from monocytes to macrophages.
(A) RcisTarget analysis was performed to screen promoters of genes enriched in modules 1, 4, and 6 of the monocyte-to-infiltrating MΦ trajectory. Pseudotime regression plots for the top four transcription factors predicted by RcisTarget to regulate enriched module genes are shown.

Update of

References

    1. Aibar S, González-Blas CB, Moerman T, Huynh-Thu VA, Imrichova H, Hulselmans G, Rambow F, Marine J-C, Geurts P, Aerts J, van den Oord J, Atak ZK, Wouters J, Aerts S. SCENIC: single-cell regulatory network inference and clustering. Nature Methods. 2017;14:1083–1086. doi: 10.1038/nmeth.4463. - DOI - PMC - PubMed
    1. Aikawa Y, Katsumoto T, Zhang P, Shima H, Shino M, Terui K, Ito E, Ohno H, Stanley ER, Singh H, Tenen DG, Kitabayashi I. PU.1-mediated upregulation of CSF1R is crucial for leukemia stem cell potential induced by MOZ-TIF2. Nature Medicine. 2010;16:580–585. doi: 10.1038/nm.2122. - DOI - PMC - PubMed
    1. Alivernini S, MacDonald L, Elmesmari A, Finlay S, Tolusso B, Gigante MR, Petricca L, Di Mario C, Bui L, Perniola S, Attar M, Gessi M, Fedele AL, Chilaka S, Somma D, Sansom SN, Filer A, McSharry C, Millar NL, Kirschner K, Nerviani A, Lewis MJ, Pitzalis C, Clark AR, Ferraccioli G, Udalova I, Buckley CD, Gremese E, McInnes IB, Otto TD, Kurowska-Stolarska M. Distinct synovial tissue macrophage subsets regulate inflammation and remission in rheumatoid arthritis. Nature Medicine. 2020;26:1295–1306. doi: 10.1038/s41591-020-0939-8. - DOI - PubMed
    1. Atukorala I, Kwoh CK, Guermazi A, Roemer FW, Boudreau RM, Hannon MJ, Hunter DJ. Synovitis in knee osteoarthritis: a precursor of disease? Annals of the Rheumatic Diseases. 2016;75:390–395. doi: 10.1136/annrheumdis-2014-205894. - DOI - PMC - PubMed
    1. Belkina AC, Ciccolella CO, Anno R, Halpert R, Spidlen J, Snyder-Cappione JE. Automated optimized parameters for T-distributed stochastic neighbor embedding improve visualization and analysis of large datasets. Nature Communications. 2019;10:5415. doi: 10.1038/s41467-019-13055-y. - DOI - PMC - PubMed

Substances

Associated data