. 2025 Feb 21;11(8):eadr1453.
doi: 10.1126/sciadv.adr1453. Epub 2025 Feb 19.

Disabling leading and lagging strand histone transmission results in parental histones loss and reduced cell plasticity and viability

Affiliations

Disabling leading and lagging strand histone transmission results in parental histones loss and reduced cell plasticity and viability

Leonie Kollenstart et al. Sci Adv. .

Abstract

In the process of DNA replication, the first steps in restoring the chromatin landscape involve parental histone recycling and new histone deposition. Disrupting histone recycling to either the leading or lagging strand induces asymmetric histone inheritance, affecting epigenome maintenance and cellular identity. However, the order and kinetics of these effects remain elusive. Here, we use inducible mutants to dissect the early and late consequences of impaired histone recycling. Simultaneous disruption of both leading (POLE4) and lagging strand (MCM2-2A) recycling pathways impairs the transmission of parental histones to newly synthesized DNA, releasing some parental histones to the soluble pool. Subsequently, H3K27me3 accumulates aberrantly during chromatin restoration in a manner preceding gene expression changes. Loss of histone inheritance and the ensuing chromatin restoration defects alter gene expression in embryonic stem cells and challenge differentiation programs and cell viability. Our findings demonstrate the importance of efficient transmission of histone-based information during DNA replication for maintaining chromatin landscapes, differentiation potential, and cellular viability.


Figures
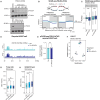
Fig. 1.
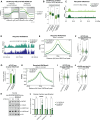
Fig. 1.. Inducing asymmetry through loss of POLE4 leads to increased global H3K27me3 levels within 24 hours.
(A) Western blot analysis of POLE4-dTAG mESC with DMSO and dTAG-13 treatment. (B) Average SCAR-seq profile showing the H4K20me2 and H4K20me0 partition in 1-kb windows around initiation zones (IZs) of DMSO-treated (Ctrl) or dTAG-treated (dPOLE4) in POLE4-dTAG mESC. Partition is calculated as the proportion of forward (F) and reverse (R) read counts [(FR)/(F + R)], see Materials and Methods. n = 2 biological replicates. (C) Box plots of H4K20me2 and H4K20me0 partition in 1-kb windows around IZ in POLE4-dTAG cells. Windows upstream of IZs were multiplied by −1. Lines indicate median, boxes represent first, and third quartiles and whiskers extend 1.5× interquartile range. Wilcoxon signed-rank test. ***P < 2.220446e-16. (D) ChOR-seq occupancy tracks for H3K27me3 on nascent DNA in DMSO (Ctrl, top)–or 2-hour dTAG-13 (dPOLE4, bottom)–treated POLE4-dTAG cells. Signal is quantified with reads per million (RPMs). (E) Bar plot of mapped reads (mouse) relative to spike-in reads (Drosophila) for H3K27me3 in POLE4-dTAG mESC treated with DMSO (Ctrl) or dTAG-13 (dPOLE4). Normalized to input. (F) Box plot showing H3K27 methylation levels quantified by MS after 72-hour dTAG-13 treatment. n = 4 independent replicates. Box plot as in (C). Two-sided Welch’s t test false discover rate (FDR). *P = 0.031. (G and H) Box plot showing total H3 (G) and H3K27me3 (H) levels quantified with high-content microscopy in POLE4-dTAG mESC-treated with DMSO (Ctrl) or dTAG-13 (dPOLE4). n = 3 biological replicates. Box plot as in (C). P values, Student t test (two-tailed, paired), performed on the means of the biological replicates. Ctrl vs 24-h dPOLE4 (top) *P = 0.018, Ctrl vs 72-h dPOLE4 (bottom) *P = 0.04. h, hours; ns, not significant.
Fig. 2.
Fig. 2.. Simultaneous disruption of leading and lagging strand histone recycling results in parental histone loss.
Average SCAR-seq profile (A) or box plots (B) show the H4K20me2 and H4K20me0 partition in 1-kb windows around IZs of DMSO (Ctrl MCM2-2A)–or dTAG-13 (dPOLE4 MCM2-2A)–treated POLE4-dTAG MCM2-2A mESC. n = 2 biological replicates. Box plot as in Fig. 1C. Wilcoxon signed-rank test. (C and D) Occupancy tracks for H3K27me3 (C) or H3K36me3 (D) on nascent DNA in DMSO (Ctrl MCM2-2A, top)–or dTAG-13 (dPOLE4 MCM2-2A, bottom)–treated POLE4-dTAG MCM2-2A mESC. Signal is represented in RPMs. (E) Signal of H3K27me3 overlapping the H3K27me3 peaks upon DMSO or 2-hour dTAG-13 treatment in POLE4-dTAG MCM2-2A mESC. n = 4 biological replicates. Wild levels (DMSO-treated POLE4-dTAG cells) are shown in gray. (F) Average profile of recycled H3K27me3 across total H3K27me3 peaks in DMSO or 2-hour dTAG-13. Signal quantified with reference-adjusted RPMs using exogenous spike-in chromatin (RRPM). n = 2 biological replicates. Wilcoxon signed-rank test. (G) Bar plot of mapped reads (mouse) relative to spike-in reads (Drosophila) for H3K27me3 in POLE4-dTAG MCM2-2A mESC treated with DMSO or 2-hour dTAG-13. n = 4 biological replicates. Normalized to EdU input. (H) Average profile of recycled H3K36me3 across total H3K36me3 peaks in DMSO or 2-hour dTAG-13. Signal is quantified as in (E). n = 3 biological replicates. (I) Average profile of recycled H3K36me3 occupancy across H3K36me3 peaks in DMSO (Ctrl MCM2-2A) or dTAG-13 (dPOLE4 MCM2-2A). Analyzed as in (F). n = 3 biological replicates. (J) Average profile of total H3 occupancy in genome-wide bins after DMSO or dTAG-13 treatment. Analyzed as in (F). n = 3 biological replicates. Western blot analysis (K) and quantification (L) of POLE4-dTAG and POLE4-dTAG MCM2-2A mESC protein soluble fraction treated for 48 hours with DMSO or dTAG-13. Data normalized to MCM2 levels. n = 6 biological replicates. *P = 0.00270; ***P < 2.220446e-16; ****P < 0.001.
Fig. 3.
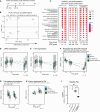
Fig. 3.. Simultaneous disruption of leading and lagging strand histone recycling results in gain of H3K27me3, decreased expression of histone and formative pluripotency factors, and loss of viability.
(A) Box plot showing global H3K27 methylation levels quantified by MS. n = 4 biological replicates. *P = 0.043 for me0. (B and C) High-content microscopy of H3K27me3 (B) and H3 (C) levels in POLE4-dTAG MCM2-2A mESC treated with DMSO (Ctrl MCM2-2A) or dTAG-13 (dPOLE4 MCM2-2A). n = 3 biological replicates. *P = 0.0423; **P = 0.015. (D) Volcano plot showing differential expression analysis of genes and repeat subfamily expression in 24-hour POLE4-depleted MCM2-2A mESC (dPOLE4 MCM2-2A/Ctrl MCM2-2A). Fold change (FC) against false discovery rate (FDR) adjusted P value is shown per gene in 24-hour dTAG-13 (dPOLE4 MCM2-2A) versus DMSO (Ctrl MCM2-2A). Significant genes (|log2 fold change | > 0.58, adjusted P value < 0.01) are depicted in light blue or pink (histone transcripts). n = 3 biological replicates. (E) Relative RNA level (z score normalized) of all histone genes from RNA-seq performed in 2D. Boxplot shows the distribution of histone genes. Wilcoxon signed-rank test. ****P = 8.2e-18. (F) Volcano plot showing differential expression analysis of genes and repeat subfamily expression after 96-hour POLE4 depletion in MCM2-2A mESC (dPOLE4 MCM2-2A/Ctrl MCM2-2A). Cutoff and annotation as in (D). (G) Scatterplot of DE genes in the MCM2-2A background (MCM2-2A/WT). Y axis shows log2 fold change of MCM2-2A/WT, and x axis shows log2 fold change of dPOLE4 MCM2-2A/WT. DE genes after 96-hour POLE4 depletion in MCM2-2A from (F) are highlighted in blue. Spearman correlation coefficient (ρ) with P value. (H) Cell-Titer Blue viability assay of POLE4-dTAG and POLE4-dTAG MCM2-2A mESC with DMSO and dTAG-13 treatment for the indicated times. Data were normalized to DMSO-treated POLE4-dTAG mESC [72 hours, n = 4 biological replicates; 96 hours, n = 3 biological replicates. Student t test (two-tailed, paired)]. ****P < 0.0001.
Fig. 4.
Fig. 4.. Simultaneous disruption of leading and lagging strand histone recycling during RA differentiation impairs down-regulation of repeat expression and (formative) pluripotency factors.
(A) Scheme of dTAG and RA treatment and RNA-seq time points. Cells were first grown in fetal bovine serum (FBS) + leukemia inhibitory factor (LIF) conditions and treated with DMSO or dTAG for 24 hours. After 24 hours, cells were grown in medium containing RA without LIF. (B) PCA of RNA-seq samples during RA treatment generated from all expressed genes in POLE4-dTAG and POLE4-dTAG MCM2-2A mESC treated with dTAG13 (dPOLE4, dPOLE4 MCM2-2A) or DMSO (Ctrl, Ctrl MCM2-2A). (C) Dot plot gene ontology (GO) analysis of biological processes in the down-regulated genes and up-regulated genes in POLE4-depleted mESC (dPOLE4 versus Ctrl), steady-state MCM2-2A mESC (Ctrl MCM2-2A versus Ctrl), and POLE4-depleted MCM2-2A mESC (dPOLE4 MCM2-2A versus Ctrl MCM2-2A). Gene ontology is performed on DE genes uniquely changed upon RA treatment. (D to H) Z score normalized expression analysis of (D) LINE (n = 158 genes), (E) LTR elements (n = 838 genes), (F) naïve pluripotency and self-renewal genes (n = 13 genes), (G) formative pluripotency genes (n = 8 genes), and (H) early RA response genes (n = 6 genes), in POLE4-dTAG and POLE4-dTAG MCM2-2A mESCs treated with DMSO (Ctrl, Ctrl MCM2-2A) or dTAG13 (dPOLE4, dPOLE4 MCM2-2A). n = 3 biological replicates. (I) Cell-Titer Blue viability assay of dPOLE4 and dPOLE4 MCM2-2A mESC growing under RA conditions for the indicated treatments. Data normalized to DMSO-treated dPOLE4 mESC in FBS + LIF. Two-way analysis of variance (ANOVA; three biological replicates for dPOLE4 cells and four biological replicates for dPOLE4 MCM2-2A mESC). Ctrl vs Ctrl MCM2-2A (top) **P = 0.0080, Ctrl MCM2-2A vs dPOLE4 MCM2-2A (bottom) **P = 0.0031.

References

    1. Flury V., Reverón-Gómez N., Alcaraz N., Stewart-Morgan K. R., Wenger A., Klose R. J., Groth A., Recycling of modified H2A-H2B provides short-term memory of chromatin states. Cell 186, 1050–1065.e19 (2023). - PMC - PubMed
    1. Yu C., Gan H., Serra-Cardona A., Zhang L., Gan S., Sharma S., Johansson E., Chabes A., Xu R.-M., Zhang Z., A mechanism for preventing asymmetric histone segregation onto replicating DNA strands. Science 361, 1386–1389 (2018). - PMC - PubMed
    1. Petryk N., Dalby M., Wenger A., Stromme C. B., Strandsby A., Andersson R., Groth A., MCM2 promotes symmetric inheritance of modified histones during DNA replication. Science 361, 1389–1392 (2018). - PubMed
    1. Stewart-Morgan K. R., Petryk N., Groth A., Chromatin replication and epigenetic cell memory. Nat. Cell Biol. 22, 361–371 (2020). - PubMed
    1. Reverón-Gómez N., González-Aguilera C., Stewart-Morgan K. R., Petryk N., Flury V., Graziano S., Johansen J. V., Jakobsen J. S., Alabert C., Groth A., Accurate recycling of parental histones reproduces the histone modification landscape during DNA replication. Mol. Cell 72, 239–249.e5 (2018). - PMC - PubMed

LinkOut - more resources