. 2025 Feb 21;11(8):eado2830.
doi: 10.1126/sciadv.ado2830. Epub 2025 Feb 19.

The mutational landscape and functional effects of noncoding ultraconserved elements in human cancers

Affiliations

The mutational landscape and functional effects of noncoding ultraconserved elements in human cancers

Recep Bayraktar et al. Sci Adv. .

Abstract

The mutational landscape of phylogenetically ultraconserved elements (UCEs), especially those in noncoding DNAs (ncUCEs), and their functional relevance in cancers remain poorly characterized. Here, we perform a systematic analysis of whole-genome and in-house targeted UCE sequencing datasets from more than 3000 patients with cancer of 13,736 UCEs and demonstrate that ncUCE somatic alterations are common. Using a multiplexed CRISPR knockout screen in colorectal cancer cells, we show that the loss of several altered ncUCEs significantly affects cell proliferation. In-depth functional studies in vitro and in vivo further reveal that specific ncUCEs can be enhancers of tumor suppressors (such as ARID1B) and silencers of oncogenic proteins (such as RPS13). Moreover, several miRNAs located in ncUCEs are recurrently mutated. Mutations in miR-142 locus can affect the Drosha-mediated processing of precursor miRNAs, resulting in the down-regulation of the mature transcript. These results provide systematic evidence that specific ncUCEs play diverse regulatory roles in cancer.


Figures
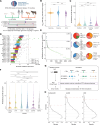
Fig. 1.
Fig. 1.. The global mutational pattern of UCEs in cancer.
(A) Cartoon summary of identification of the UCEs for this study. (B) Comparison of the germline mutation rate across the entire genome, the exome, and the UCEs based on the SNP rate in the 1000 Genomes Project. (C) Comparison of somatic mutation rates in protein-coding sequences, UCEs (both coding and noncoding), coding UCEs, and ncUCEs. P values are based on Wilcoxon test for matched samples. (D) ncUCE mutation frequency per tumor. The distribution of ncUCE mutations per tumor across different cancer types. Box plots, the middle line in the box is the mean, the bottom and top of the box are the first and third quartiles, and the whiskers extend to the 1.5× interquartile range of the lower and the upper quartiles, respectively. (E) The percentages of tumors with hypermutated, highly mutated, and lowly mutated/nonmutated ncUCE phenotypes and their correlations with MMR deficiency and POL (POL D and E) and TP53 mutations or with patient age. (F) Locations of somatic UCE and human-specific regulatory element (HSRE) mutations in the human genome. ncRNA, noncoding RNAs. P value is calculated by paired-sample Wilcoxon test. (G) Graphical representation of mutation burden test and simulation for discovery of driver UCE. (H) The percentage of driver coding and noncoding UCEs (red dashed line) and background distributions generated by simulation. **P < 0.01, ***P < 0.001, and ****P < 0.0001. BLCA, bladder cancer; BRCA, breast cancer; BTCA, biliary tract cancer; CESC, cervical squamous cell carcinoma; Cholangio, cholangiocarcinoma; CLL, chronic lymphocytic leukemia; CRC, colorectal cancer; EGAC, eso-gastric adenocarcinoma; CNSC, central nervous system cancer; HCC, hepatocellular carcinoma; HNSC, head and neck squamous cell carcinoma; myeloid, myeloid malignancies; NSCLC, nonsmall cell lung cancer; OV, ovarian cancer; PACA, pancreatic cancer; PNET, pancreatic neuroendocrine tumors; RCC, renal cell carcinoma; BSTC, bone and soft tissue cancer; THCA, thyroid cancer; UCEC, uterine corpus endometrial carcinoma.
Fig. 2.
Fig. 2.. A genome-wide CRISPR knockout screen characterizing the impact of mutated ncUCEs on cell proliferation.
(A) Selection of the UCEs for the AsCpf1-based multiplexed library screening and schematic representation of the AsCpf1-based multiplexed library screening workflow. (B) Z score of positive hits identified in the proliferation assay for mutated ncUCEs in three CRC cell lines (RKO, DLD-1, and HT-29). (C) Characterization of the ncUCE hits identified in the CRISPR knockout screen.
Fig. 3.
Fig. 3.. UCE_11311 functions as an enhancer in vitro.
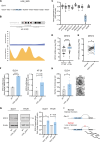
(A) Representation of the genomic position of UCE_11311 within chromosome 6. UCE_11311 is located within an intronic region of ARID1B. Neighboring genes to the UCE_11311 include TMEM242, ZDHHC14, SNX9, SYNJ2, and SERAC1. (B) Density plots showing the normalized levels of H3K27ac and H3K27me3 at the UCE_11311 in CRC cell lines HT-29 (top) and HCT-116 (bottom) by ChIP-seq assays. (C) Relative mRNA expression of ARID1B in the parental and UCE_11311KO CRC cells using qRT-PCR, normalized to the housekeeping gene ACTB. (D) Western blotting and fold change (FC) quantification of ARID1B protein expression in parental and UCE_11311KO CRC cells. β-Actin protein is shown as a loading control. [(C) and (D)] qRT-PCR and Western blot were performed in biological triplicates. (E) Colony formation assay in parental and UCE_11311KO CRC cells for 12 days and representative images. (F) A proposed model for UCE_11311 on the regulation of ARID1B as an enhancer. UCE_11311 has a notable impact on ARID1B expression, while mutated UCE_11311 significantly reduces the ARID1B expression level. At least three independent experiments were performed. *P < 0.05, and **P < 0.01. Experiments were performed in biological triplicates.
Fig. 4.
Fig. 4.. UCE_2272 functions as a silencer in vitro.
(A) Representation of the genomic position of UCE_2272 within chromosome 11. UCE_2272 is located within an intronic region of SOX6. Neighboring genes to the UCE_2272 include CALCA, INSC, PLEKHA7, RPS13, PIK3C2A, NUCB2, and KCNJ11. (B) Density plots showing the normalized levels of H3K27me3 and H3K27ac at the UCE_2272 in CRC cell lines HT-29 (top) and HCT-116 (bottom) by ChIP-seq assays. (C) The effects on proliferation of 15 CRC cell lines with CRISPR knockout of protein-coding genes localized in the neighborhood of UCE_2272. (D) The mRNA expression of RPS13 in normal colon (n = 355) and CRC (n = 380) samples. P value, t test. (E) The mRNA expression of RPS13 in 26 matched pairs of normal colon and colon adenocarcinoma samples from the TCGA database. P value, paired t test. (F) Relative mRNA expression of RPS13 in the parental and UCE_2272KO CRC cells using qRT-PCR, normalized to the housekeeping gene ACTB. (G) Western blotting and FC quantification of RPS13 protein expression in parental and UCE_2272KO CRC cells. β-Actin protein is shown as a loading control. (F and G) qRT-PCR and Western blot were performed in biological triplicates. (H) Colony formation assay in parental and UCE_2272KO CRC cells for 12 days and representative images. (I) A proposed model for UCE_2272 on the regulation of oncogenic RPS13 as a silencer. UCE_2272 has a substantial impact on RPS13 expression, while mutated UCE_2272 significantly increases the RPS13 expression level. At least three independent experiments were performed. *P < 0.05, and ****P < 0.0001. Experiments were performed in biological triplicates.
Fig. 5.
Fig. 5.. Effects of UCE_11311 and UCE_2722 on tumorigenesis in vivo.
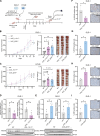
(A) Schematic of in vivo experiments using athymic nude mice. Parental, UCE_2272KO, UCE_11311KO DLD-1, or HT-29 cells (1 × 106) were inoculated subcutaneously (sc) into mice. Tumor size was measured using an electric caliper twice a week starting from the seventh day after tumor cell inoculation in each group. (B and C) The represented tumor growth curve (left), tumor weight (middle), and subcutaneous xenograft tumors (right) using DLD-1 (B) and HT-29 (C). Mouse xenograft tumorigenic assays using stable UCE_2272KO, UCE_11311KO, and WT cells. Each group contains eight animals at the beginning of the experiment. Mean ± SEM, two-tailed, unpaired t test is used, *P < 0.05. (D and E) qRT-PCR and Western blot quantifications of ARID1B (D) and RPS13 (E) in xenograft tumors. (F and G) Immunohistochemical staining and quantification of ARID1B (F) and RPS13 (G) protein in subcutaneous tumors from mice injected with UCE_11311KO and WT DLD-1 cells. Scale bars, 100 μm. (H and I) Immunohistochemical staining of the Ki67 in paraffin-embedded xenograft tumors from mice injected with WT, UCE_11311KO (H), or UCE_2272KO (I) DLD-1 cells. *P < 0.05 and **P < 0.01. All immunohistochemical results are shown as the mean % of positive cells ± SEM. All immunohistochemical slides were scanned and quantified using Visiopharm software. Experiments in vivo were performed in biological duplicates. GAPDH, glyceraldehyde phosphate dehydrogenase.
Fig. 6.
Fig. 6.. Mutation patterns and functional effects of UCE mutations in MIR142.
(A) Frequency of UCE mutations in the ICGC PCAWG. (B) UCE mutations of mature and precursor MIR142 (UCE_5578). Mutations in different cohorts are shown in different symbols. (C to F) The relative expression levels of primary miR-142 (C), precursor miR-142 (D), miR-142-3p (E), and miR-142-5p (F) in HEK293 cells transfected with plasmids encoding either a WT sequence or one bearing the mutation. (G and H) qRT-PCR analysis of SRSF3 (G) and miR-142-3p (H) after siRNA transfection in HEK293 and HG3 cells. At least three independent experiments were performed. *P < 0.05, **P < 0.01, and ****P < 0.0001. (I) A proposed model showing how somatic mutations in MIR142 affect secondary RNA structure: Blocking of SRSF3 binding results in decreased microprocessor-mediated processing of miR-142. This suggests that SRSF3 plays a role in regulating the expression of miR-142 through its effects on microprocessor activity. Experiments were performed in biological triplicates. ns, not significant.

References

    1. Calin G. A., Trapasso F., Shimizu M., Dumitru C. D., Yendamuri S., Godwin A. K., Ferracin M., Bernardi G., Chatterjee D., Baldassarre G., Rattan S., Alder H., Mabuchi H., Shiraishi T., Hansen L. L., Overgaard J., Herlea V., Mauro F. R., Dighiero G., Movsas B., Rassenti L., Kipps T., Baffa R., Fusco A., Mori M., Russo G., Liu C.-G., Neuberg D., Bullrich F., Negrini M., Croce C. M., Familial cancer associated with a polymorphism in ARLTS1. N. Engl. J. Med. 352, 1667–1676 (2005). - PubMed
    1. Jardim D. L., Goodman A., de Melo Gagliato D., Kurzrock R., The challenges of tumor mutational burden as an immunotherapy biomarker. Cancer Cell 39, 154–173 (2021). - PMC - PubMed
    1. Stark R., Grzelak M., Hadfield J., RNA sequencing: The teenage years. Nat. Rev. Genet. 20, 631–656 (2019). - PubMed
    1. Watson I. R., Takahashi K., Futreal P. A., Chin L., Emerging patterns of somatic mutations in cancer. Nat. Rev. Genet. 14, 703–718 (2013). - PMC - PubMed
    1. Zehir A., Benayed R., Shah R. H., Syed A., Middha S., Kim H. R., Srinivasan P., Gao J., Chakravarty D., Devlin S. M., Hellmann M. D., Barron D. A., Schram A. M., Hameed M., Dogan S., Ross D. S., Hechtman J. F., DeLair D. F., Yao J., Mandelker D. L., Cheng D. T., Chandramohan R., Mohanty A. S., Ptashkin R. N., Jayakumaran G., Prasad M., Syed M. H., Rema A. B., Liu Z. Y., Nafa K., Borsu L., Sadowska J., Casanova J., Bacares R., Kiecka I. J., Razumova A., Son J. B., Stewart L., Baldi T., Mullaney K. A., Al-Ahmadie H., Vakiani E., Abeshouse A. A., Penson A. V., Jonsson P., Camacho N., Chang M. T., Won H. H., Gross B. E., Kundra R., Heins Z. J., Chen H. W., Phillips S., Zhang H., Wang J., Ochoa A., Wills J., Eubank M., Thomas S. B., Gardos S. M., Reales D. N., Galle J., Durany R., Cambria R., Abida W., Cercek A., Feldman D. R., Gounder M. M., Hakimi A. A., Harding J. J., Iyer G., Janjigian Y. Y., Jordan E. J., Kelly C. M., Lowery M. A., Morris L. G. T., Omuro A. M., Raj N., Razavi P., Shoushtari A. N., Shukla N., Soumerai T. E., Varghese A. M., Yaeger R., Coleman J., Bochner B., Riely G. J., Saltz L. B., Scher H. I., Sabbatini P. J., Robson M. E., Klimstra D. S., Taylor B. S., Baselga J., Schultz N., Hyman D. M., Arcila M. E., Solit D. B., Ladanyi M., Berger M. F., Mutational landscape of metastatic cancer revealed from prospective clinical sequencing of 10,000 patients. Nat. Med. 23, 703–713 (2017). - PMC - PubMed