Clinical Trial
. 2025 Feb 19;17(786):eadn6274.
doi: 10.1126/scitranslmed.adn6274. Epub 2025 Feb 19.

A window-of-opportunity trial reveals mechanisms of response and resistance to navtemadlin in patients with recurrent glioblastoma

Affiliations
Clinical Trial

A window-of-opportunity trial reveals mechanisms of response and resistance to navtemadlin in patients with recurrent glioblastoma

Veronica Rendo et al. Sci Transl Med. .

Abstract

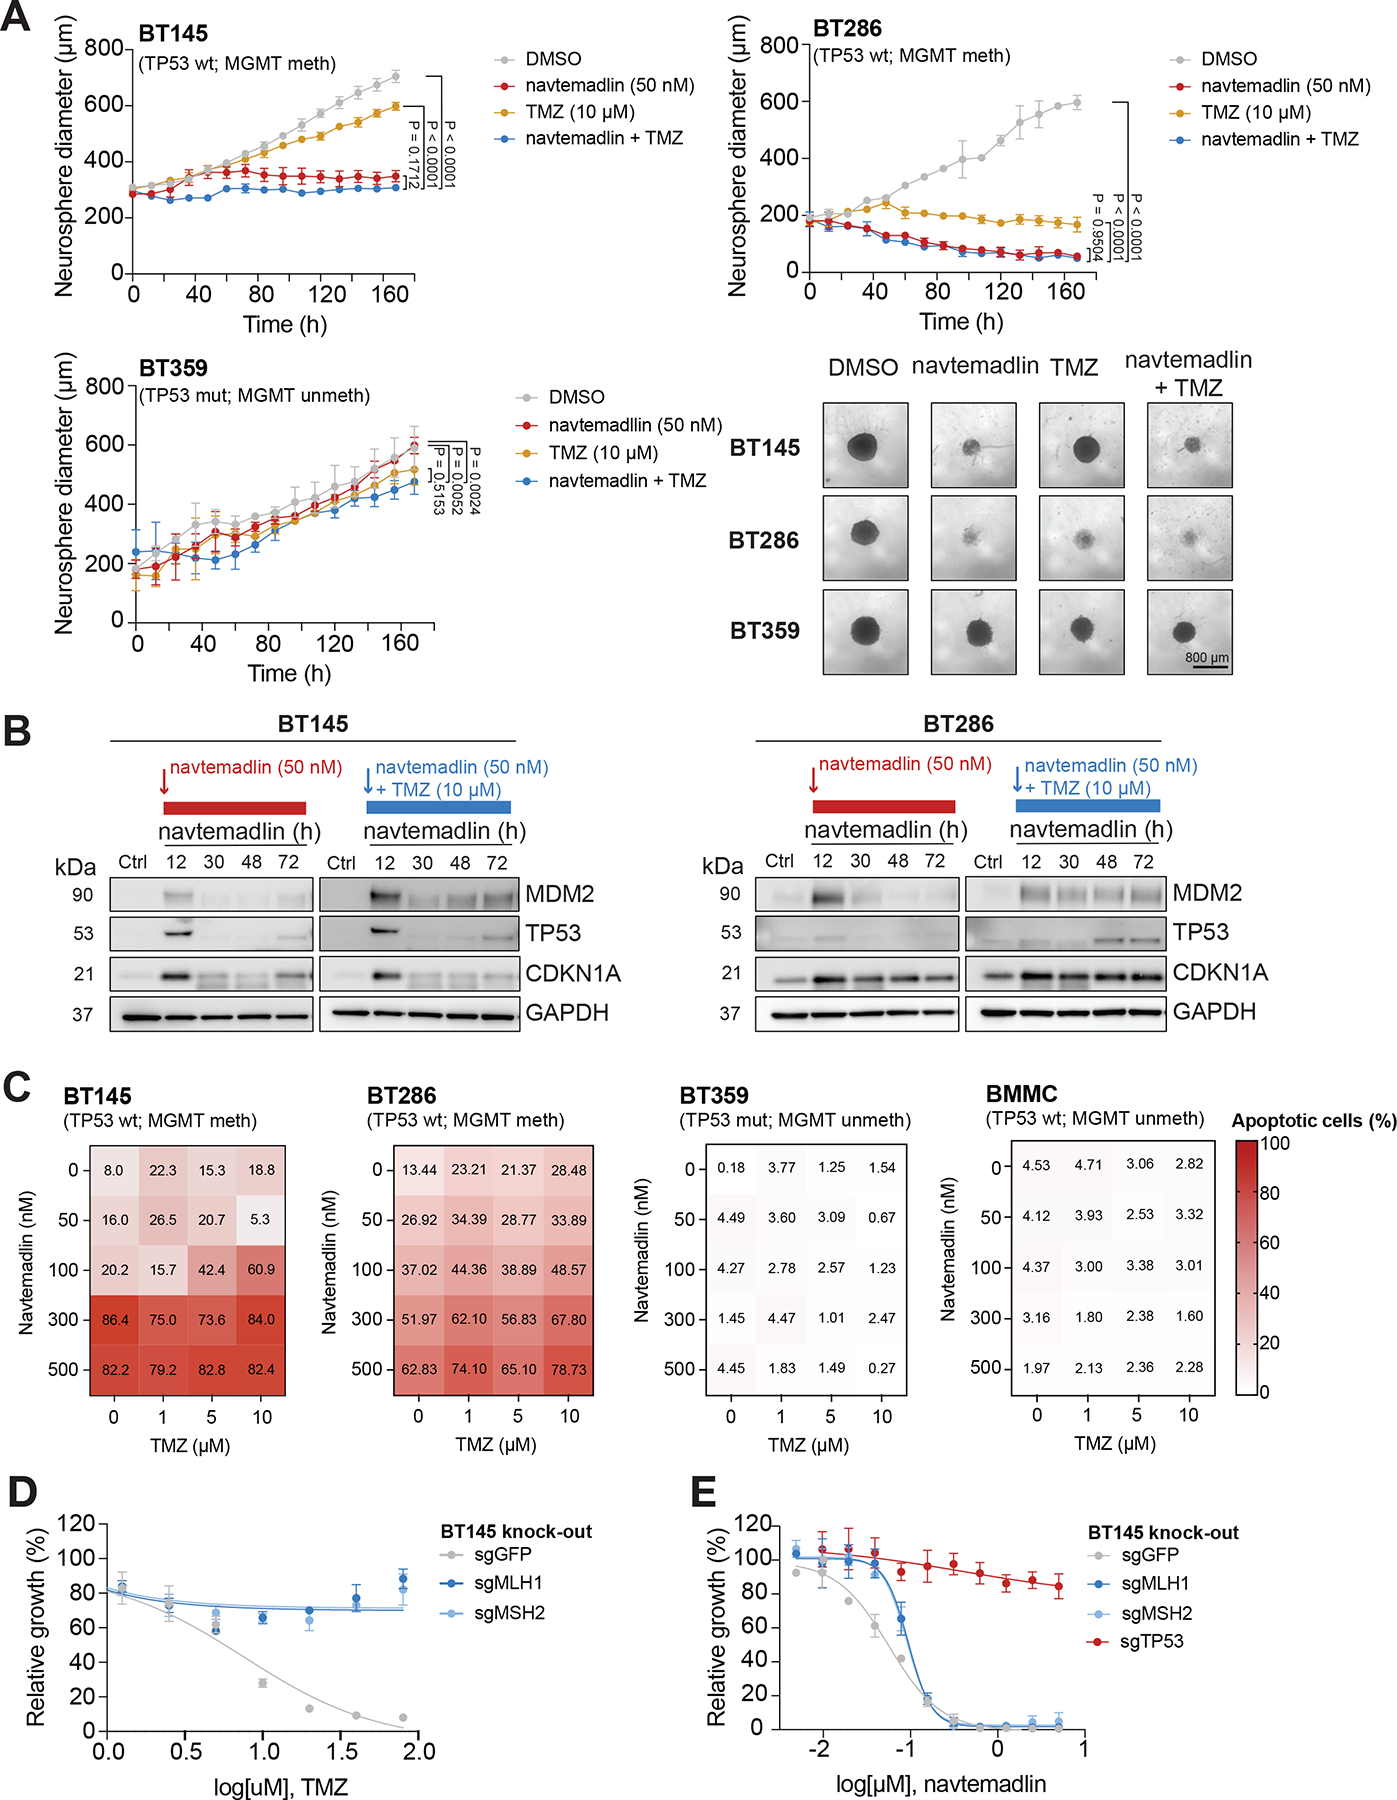
Inhibitors of murine double minute homolog 2 (MDM2) represent a promising therapeutic approach for the treatment of TP53 wild-type glioblastomas (GBMs), reactivating p53 signaling to induce cancer cell death. We conducted a surgical window-of-opportunity trial (NCT03107780) of the MDM2 inhibitor navtemadlin (KRT-232) in 21 patients with TP53 wild-type recurrent GBM to determine achievable drug concentrations within tumor tissues and biological mechanisms of response and resistance. Participants received navtemadlin at 120 mg (n = 10) or 240 mg (n = 11) for 2 days before surgical resection and after surgery until progression or unacceptable toxicity. Both 120 and 240 mg daily dosing achieved a pharmacodynamic impact, but median progression-free survival was 3.1 months. DNA sequencing of three recurrent tumors revealed an absence of TP53-inactivating mutations, indicating alternative mechanisms of resistance. To understand the mechanisms of response and resistance associated with navtemadlin, we conducted functional and spatial analyses of human tissue and patient-derived GBM neurosphere models. Navtemadlin induced partial tumor cell death as monotherapy, and combination with temozolomide enhanced apoptosis in GBM neurospheres while sparing normal bone marrow cells in vitro. We also observed up-regulation of oligodendrocyte differentiation genes with navtemadlin treatment and enrichment of oligodendrocyte transcription factor 2 (OLIG2)-positive cells at relapse, suggesting an unexplored mechanism of navtemadlin tolerance in GBM. Overall, these results indicated that clinically achievable doses of navtemadlin exert pharmacodynamic effects on GBM and suggest that combined treatment with temozolomide may be a route to more durable survival benefits.


Conflict of interest statement

N.Y.R.A is key opinion leader for Bruker Daltonics, and receives support from Thermo Finnegan and EMD Serono. The other authors declare no competing financial interests.

Figures

Figure 1.
Figure 1.. Trial schema and outcomes.
(a) Overall schema for ABTC-1604 clinical trial and (b) CONSORT diagram. (c) Timeline for enrolled patients, indicating the duration of standard-of-care (yellow), adjuvant TMZ (purple), navtemadlin (red), as well as other (gray) or unknown (black line) treatments. The first nine patients had pre-treatment and on-navtemadlin matched biopsies available for downstream analyses. (d) Kaplan-Meier curves of overall survival (OS) and progression-free survival (PFS) in the patient presurgical dose cohorts. (e) LC-MS/MS-derived pharmacokinetic data in contrast enhancing tissue from patients receiving 120 mg (n=7) or 240 mg (n=8) navtemadlin. (f) Microscopy and mass spectrometry images of frozen tissue sections collected from two research subjects with TP53 wild-type (UP-1604–0230) and TP53 mutant (DF-1604–0123) from specimens resected in MRI contrast enhancing (CE) and non-enhancing (NCE) tumor regions. Ion images of navtemadlin (m/z 301.051) and heme b (m/z 616.178) are displayed for each specimen. Bar graph represents the average ion intensity across each tissue section, revealing higher ion intensities in specimens acquired from contrast enhancing regions compared to non-enhancing regions.
Figure 2.
Figure 2.. Evaluation of navtemadlin’s pharmacodynamic response in patient tumors.
(a) Percentage of tumor cells expressing p53, CDKN1A and Ki67, as determined by immunohistochemistry and subsequent quantification of positive nuclei. Scale bar = 50 μm. (b) Fold-change in expression of TP53 transcriptional targets in navtemadlin patient biopsies (red; on-treatment vs pre-treatment sample) and SOC-treated GLASS control samples (gray; recurrence vs primary tumor sample). Significant gene upregulation is denoted with a red p-value. (c) Correlation between CDKN1A gene expression and progression-free survival (PFS). (d) In vitro signatures of p53 pathway activation were created by bulk RNA sequencing of two TP53 wild-type GBM cell lines. GSEA was performed to look at enrichment in pre- and on-treatment patient biopsies and controls. (e) Differential expression analysis and commonly dysregulated genes in BT145 and BT286 cells. (f) Enrichment of on-navtemadlin patient biopsies for p53 pathway signatures. (g) Enrichment of GLASS control samples for p53 pathway signatures. (h) Dysregulated genes in pre-treatment and on-treatment patient biopsies. Differential gene expression was determined with cutoffs of FDR 5% and log2 fold-change ± 1. (i-j) Geneset enrichment analysis for (i) on-navtemadlin patient biopsies and (j) GLASS control samples using Hallmark genesets. Pathways enriched with navtemadlin treatment and not present SOC controls are shown in red.
Figure 3.
Figure 3.. Effect of clinically relevant doses of navtemadlin on cell death.
(a) Immunohistochemistry of p53 in three patients with available pre-treatment, on-treatment, and post-treatment biopsy samples. Scale bar = 100 μm. (b) Dose response curves showing sensitivity of TP53 wild-type GBM cells (BT145 and BT286; yellow), TP53 mutant GBM cells (BT359; red), bone marrow cells (BMMC; gray), human immortalized astrocytes (hAstro; dark gray), and human neural stem cells (hNSC; light gray) to navtemadlin. (c) Immunoblotting of BT145 and BT286 cells treated with 50 nM navtemadlin over time. Vinculin was included as a loading control. (d) Growth of BMMCs in response to navtemadlin treatment. Growth phenotypes shown under treatment with 50–5000 nM navtemadlin (red box) and drug washout from media (gray box). (e) Effect of continuous (light red) and single pulse (dark red) navtemadlin treatment modalities on cell death. For the single pulse modality, tested navtemadlin concentrations were: 100 nM in BT145, 75 nM in BT286, and 500 nM in BT359 and BMMCs. Apoptosis was quantified by annexin V/PI stainings. Data analyzed by Two-way ANOVA. (f) Immunoblotting of BT145 and BT286 cells treated with increasing concentrations of navtemadlin over 72h. Vinculin was included as a loading control. (g) Effect of increased navtemadlin treatment on tumor cell death. Apoptosis was quantified by annexin V/PI stainings after 72h of continuous drug treatment. Data analyzed by Two-way ANOVA.
Figure 4.
Figure 4.. Effect of combination therapy with navtemadlin and TMZ on cell death rates.
(a) Growth of TP53 wild-type BT145 and BT286 cells when treated continuously with navtemadlin and TMZ as monotherapy or in combination. Growth of TP53 mutant BT359 cells was performed as control. Mean and standard deviation of three technical replicates shown. Data analyzed by Two-way ANOVA. Neurosphere diameter was quantified by live imaging over the course of 160 h for cells treated with navtemadlin (red), TMZ (yellow) or combination therapy (blue). Representative images of TP53 wild-type (BT145 and BT286) and TP53 mutant cells treated for each condition are shown to the right. Scale bar: 800 μm. Data analyzed by Two-way ANOVA. (b) Immunoblot of BT145 (left) and BT286 (right) cells treated with navtemadlin as monotherapy or in combination with TMZ for up to 72h. (c) Effect of navtemadlin and TMZ combinations on cell death. (d-e) Dose response curve showing sensitivity of BT145 MLH1 and MSH2 knock-out cells to treatment with (d) TMZ and (e) navtemadlin. A GFP sgRNA was used as CRISPR/Cas9 targeting control. Mean and standard deviation of three technical replicates shown.
Figure 5.
Figure 5.. Effect of navtemadlin treatment in glioma cell differentiation.
(a) Genes that become significantly deregulated with navtemadlin treatment (red; FDR cutoff 5%) include regulators of oligodendrocyte differentiation (blue). Gene Set enrichment analysis in (b) patient biopsies and (c) GLASS control samples using the cell state signatures described in (27). (d) Oligodendrocyte differentiation ssGSEA scores for two patients with pre-, on-, and post-treatment samples. (e) Quantification of OLIG2-positive tumor cells by IHC. (f) UMAP unsupervised clustering of BT145 cells treated with 50 nM navtemadlin or DMSO control. (g) Number of cells per condition present in each cluster. (h) Markers defining cluster 3 when compared to remaining clusters. (i-j) Expression of (i) Hallmark p53 pathway and (j) oligodendrocyte differentiation gene signatures in BT145 cells and projection on the UMAP.

Update of

References

    1. Zhang Y, Dube C, Gibert M Jr, Cruickshanks N, Wang B, Coughlan M, Yang Y, Setiady I, Deveau C, Saoud K, Grello C, Oxford M, Yuan F, Abounader R, The p53 Pathway in Glioblastoma. Cancers 10 (2018), doi:10.3390/cancers10090297. - DOI - PMC - PubMed
    1. Fischer M, Census and evaluation of p53 target genes. Oncogene 36, 3943–3956 (2017). - PMC - PubMed
    1. Vassilev LT, Small-molecule antagonists of p53-MDM2 binding: research tools and potential therapeutics. Cell Cycle 3, 419–421 (2004). - PubMed
    1. Vassilev LT, Vu BT, Graves B, Carvajal D, Podlaski F, Filipovic Z, Kong N, Kammlott U, Lukacs C, Klein C, Fotouhi N, Liu EA, In vivo activation of the p53 pathway by small-molecule antagonists of MDM2. Science 303, 844–848 (2004). - PubMed
    1. Rew Y, Sun D, Discovery of a Small Molecule MDM2 Inhibitor (AMG 232) for Treating Cancer. J. Med. Chem 57, 6332–6341 (2014). - PubMed

Publication types

MeSH terms

Substances