. 2025 May 2;85(9):1644-1662.
doi: 10.1158/0008-5472.CAN-24-1130.

GLI2 Facilitates Tumor Immune Evasion and Immunotherapeutic Resistance by Coordinating WNT and Prostaglandin Signaling

Affiliations

GLI2 Facilitates Tumor Immune Evasion and Immunotherapeutic Resistance by Coordinating WNT and Prostaglandin Signaling

Nicholas C DeVito et al. Cancer Res. .

Abstract

Therapeutic resistance to immune checkpoint blockade has been commonly linked to the process of mesenchymal transformation (MT) and remains a prevalent obstacle across many cancer types. An improved mechanistic understanding for MT-mediated immune evasion promises to lead to more effective combination therapeutic regimens. Herein, we identified the hedgehog transcription factor, GLI2, as a key node of tumor-mediated immune evasion and immunotherapy resistance during MT. GLI2 generated an immunotolerant tumor microenvironment through the upregulation of WNT ligand production and increased prostaglandin synthesis. This pathway drove the recruitment, viability, and function of granulocytic myeloid-derived suppressor cells while also impairing type I conventional dendritic cell, CD8+ T-cell, and NK cell functionality. Pharmacologic inhibition of EP2/EP4 prostaglandin receptor signaling or WNT ligand secretion each reversed a subset of the immunomodulatory effects of GLI2 and prevented primary and adaptive resistance to anti-PD-1 immunotherapy, respectively. A transcriptional GLI2 signature correlated with resistance to anti-PD-1 immunotherapy in patients with stage IV melanoma. Together, these findings provide a translational roadmap to direct combination immunotherapies in the clinic. Significance: WNT and prostaglandin signaling generate an immunotolerant environment in GLI2-active tumors and can be targeted as a component of immunotherapeutic combination strategies to overcome resistance in tumors exhibiting mesenchymal plasticity.


Conflict of interest statement

Conflict of Interest Statement: B.A.H. receives research funding from Merck & Co., Lyell Therapeutics; consultant for Compugen and Amgen; honoraria from Atrium Health Wake Forest Baptist Comprehensive Cancer Center, Vanderbilt-Ingram Cancer Center, PSI CRO GmbH, and Japanese Society of Clinical Immunology; non-financial support from Roche/Genentech and Pathios. G.M.B. receives research funding from Istari Oncology, Delcath, Oncosec Medical, Replimmune, and Checkmate Pharmaceuticals. The other authors declare no competing interests.

Figures

Figure 1.
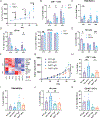
Figure 1.. GLI2 activation is associated with anti-PD-1 resistance.
(A) Depiction of canonical and non-canonical activation of GLI2. (B) Spearman correlation of GLI2 expression with WNT5A, FOXL1, and FOXC2 in the human melanoma TCGA. (C) Left, Tumor FoxL1 and FoxC2 expression in an autochthonous BRAFV600EPTEN−/− melanoma model following anti-PD-1 antibody escape based on RNAseq (n = 3 tumors/group). Right, FOXL1 and FOXC2 expression in human melanoma tissues derived from anti-PD-1 responders and non-responders based on RNAseq. (D) Western blot of the active form of GLI2, GLI2ΔN, after anti-PD-1 escape in the murine BRAFV600EPTEN−/− melanoma model. Representative of 3 independent experiments. (E) Nanostring analysis of melanoma tissues derived from stage IV melanoma patients undergoing anti-PD-1 therapy. R, responder. LR, late relapser. NR, nonresponder. ab, antibody. Data presented as mean±SEM. Two group comparisons analyzed based on unpaired student’s t test. *p<0.05,***p<0.001,****p<0.0001.
Figure 2.
Figure 2.. GLI2 drives tumor growth and immunosuppression in a murine melanoma model.
(A) Western blot analysis of WNT5a in BRAFV600EPTEN−/− GLI2CA and control BRAFV600EPTEN−/−NTC control melanoma cell lines. (B) Western blot analysis of WNT5a in the BRAFV600EPTEN−/− GLI2CA melanoma cell line treated with the direct GLI2 inhibitor, GANT61. This is the same experiment as shown in Figure 4D and includes the same control (β-Actin). (C) Gene Ontogeny (GO) Pathway Analysis of the BRAFV600EPTEN−/− GLI2CA melanoma cell line compared to control. Number of significantly upregulated genes adjacent to GO term. (D) Western blot analysis of FoxC2 and FoxL1 TFs in the BRAFV600EPTEN−/−GLI2CA and control melanoma cell lines. (E) BRAFV600EPTEN−/−NTC and BRAFV600EPTEN−/− GLI2CA melanoma tumor measurements in syngeneic mice. Flow cytometric analysis of tumor-infiltrating (F) CD3+CD8+ T cells, (G) CD11b+Ly6G+F4/80 PMN-MDSCs, and (H) ratio of cDC2s to cDC1s. (n = 6 tumors/group) (I) Whole tumor transcriptional analysis of BRAFV600EPTEN−/−NTC and BRAFV600EPTEN−/−GLI2CA melanomas. NTC, non-target control. CA, constitutively active. Data presented as mean±SEM. Representative of 2–3 independent experiments. Data analyzed by E: two-way ANOVA; F,G,H: unpaired student’s t-test. *p<0.05, ***p<0.001.
Figure 3.
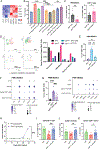
Figure 3.. Activation of GLI2 modulates immunity throughout tumor development and promotes anti-PD-1 resistance.
(A) Time course of tumor growth measurements of BRAFV600EPTEN−/−NTC and BRAFV600EPTEN−/−GLI2CA melanoma models in syngeneic mice. d, day of tissue harvest. n = 4 mice/group/time point. Flow cytometric analysis of tumor-infiltrating (B) CD3+CD8+ T cells, (C) PMN-MDSCs, (D) cDC1s (left) and cDC2s (right), (E) CD49b+NK1.1+CD3 NK cells. (F) Transcriptional analysis of viable CD45+CD11c+MHCII+CD19CD49bCD3F4/80 DCs sorted from BRAFV600EPTEN−/−NTC and BRAFV600EPTEN−/−GLI2CA melanomas. (G) Tumor growth curves from BRAFV600EPTEN−/−NTC and BRAFV600EPTEN−/− GLI2CA melanomas treated with anti-PD1 antibody (aPD1) versus IgG control. Data are representative of 2 independent experiments. Flow cytometric analysis of tumor-infiltrating (H) CD3+CD8+ T cells, (I) PMN-MDSCs, (J) NK cells, (K) CD103+XCR1+ DCs. n = 5–6 mice/group. Data are representative of 3 independent experiments. Data presented as mean±SEM. Data are analyzed by A,G-K: two-way ANOVA; B-E: unpaired student’s t-test. *p<0.05,**p<0.01,***p<0.001.
Figure 4.
Figure 4.. Prostaglandin signaling is driven by GLI2 in tumors.
(A) Volcano plot of differentially expressed genes in the BRAFV600EPTEN−/−GLI2CA and BRAFV600EPTEN−/−NTC melanoma cell lines. (B) Western blot analysis of COX2 expression in the BRAFV600EPTEN−/−NTC and BRAFV600EPTEN−/−GLI2CA melanoma cell lines. (C) ELISA of PGE2 in conditioned media derived from the BRAFV600EPTEN−/−GLI2CA and BRAFV600EPTEN−/−NTC melanoma cell lines. (D) GANT61 treatment of BRAFV600EPTEN−/− melanoma cells followed by Western blot analysis of COX2. This is the same experiment as shown in Figure 2B and includes the same control (β-Actin). (E) Western blot analysis of the mouse AKP-GLI2CA colon cancer cell line. (F) Transcriptional analysis of multiple prostaglandin pathway members in BRAFV600EPTEN−/−GLI2CA and BRAFV600EPTEN−/−GLI2KO melanoma cell lines compared with their controls. (G) GLI2 binding motif in the Ptgs2/PTGS2 gene in mice and humans (UCSD genome browser). (H) GLI2 ChIP-qPCR analysis of the BRAFV600EPTEN−/−Cas9-NTC and BRAFV600EPTEN−/−GLI2KO cell lines. (I) Correlation of an established prostaglandin signature and GLI2-associated genes in the melanoma (left), CRC (middle), and solid non-CNS tumors (right) in TCGA. KO, knockout. Data presented as mean±SEM. B-E, F, H: representative of 2–3 independent experiments. Data analyzed by C: unpaired student’s t-test; I: Spearman’s correlation. **p<0.01.
Figure 5.
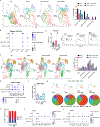
Figure 5.. GLI2-active tumors promote PMN-MDSC recruitment via WNT ligands while potentiating their suppressive function and survival through prostaglandins.
(A) Expression of PMN-MDSC recruiting chemokines in BRAFV600EPTEN−/−GLI2CA and BRAFV600EPTEN−/−NTC whole tumors based on RNAseq. (B) ELISA analysis of CXCL5 in BRAFV600EPTEN−/−NTC and BRAFV600EPTEN−/−GLI2CA cell lines ± Yap inhibitor, verteporfin (Yapi), or WNT5a silencing (WNT5aKD, ± recombinant WNT5a rescue). (C) Flow cytometric analysis of tumor-infiltrating PMN-MDSCs (left) and CD3+CD8+ T cells (right) in BRAFV600EPTEN−/−GLI2CAWNT5aKD and BRAFV600EPTEN−/−GLI2CAScr control tumors. n = 5–6 mice/group. (D) UMAP (left) and scRNAseq quantification of neutrophil subsets (right). (E) Flow cytometric analysis of tumor-infiltrating PMN-MDSCs from BRAFV600EPTEN−/−NTC and BRAFV600EPTEN−/−GLI2CA tumor-bearing mice ± ETC-159. (F) Expression of functional PMN-MDSC genes based on scRNAseq. (G) Quantification of PMN-MDSCs in TPST-1495 treated tumors by flow cytometry (left) and relevant apoptosis-related genes by scRNAseq (right). n = 5–6 mice per group. (H) Tumor volume ratios of BRAFV600EPTEN−/−NTC and BRAFV600EPTEN−/−GLI2CA tumors following Ly6G depletion. Data normalized to corresponding tumor volumes in IgG control-treated mice. (I) CD3+CD8+ T cells, (J) NK cells, (K) CD103+XCR1+ DCs. n = 10 mice/group. Scr, scramble. KD, knockdown. aLy6g, anti-Ly6G ab. Data presented as mean ± SEM. A-C, G, H-K: representative of 2 independent experiments. Data analyzed by C: unpaired student’s t-test; E, G, I-K: one-way ANOVA; B, H: two-way ANOVA. *p<0.05,**p<0.01,***p<0.001,****p<0.0001.
Figure 6.
Figure 6.. GLI2-active tumors suppress effector T and NK cells while altering DC function.
(A) UMAP (left) and scRNAseq quantification of relevant NK Cell subsets (right). (B) Expression of select genes in effector NK cells based on scRNAseq. (C) Annexin-V apoptosis flow cytometry analysis of NK cells. n = 6 mice/group. Right, representative flow plots in BRAFV600EPTEN−/−NTC and BRAFV600EPTEN−/−GLI2CA tumors. (D) UMAP (left) and scRNAseq quantification of relevant CD8+ T cell subsets (right). (E) Gene expression profiles from CD8+ T cell subsets. (F) Intra-tumoral TCF1+CD44+CD8+ T cell flow cytometry analysis of BRAFV600EPTEN−/−NTC and BRAFV600EPTEN−/−GLI2CA tumors ± ETC-159. n = 6 mice/group. (G) scRNAseq UMAP of DC subsets (above) quantification of scRNAseq DC analysis (below). (H) Flow cytometric verification of relevant cDC2:cDC1 ratios. Expression of functional (I) cDC1 and (J) cDC2 genes from scRNAseq. Data presented as mean±SEM. Apoptosis data representative of 2 independent experiments. Data analyzed by one way ANOVA (C, F). *p<0.05.
Figure 7.
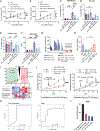
Figure 7.. GLI2-active tumors are sensitive to selective prostaglandin and WNT inhibition.
Tumor growth kinetics of (A) BRAFV600EPTEN−/−NTC and (B) BRAFV600EPTEN−/−GLI2CA tumor-bearing mice treated with TPST-1495 ± anti-PD-1. n = 6 mice/group. Flow cytometric analysis of intra-tumoral immune populations in BRAFV600EPTEN−/−NTC and BRAFV600EPTEN−/−GLI2CA tumors ±TPST-1495± anti-PD-1 including PMN-MDSCs (C), NK cells (D), CD8+ T cells (E), and the ratio of cDC2s:cDC1s (F). (G) Waterfall plot of BRAFV600EPTEN−/−NTC and BRAFV600EPTEN−/−GLI2CA tumors treated with the PORCN inhibitor ETC-159 ±anti-PD-1±TPST-1495. n = 5–7 mice/group. (H) Quantification of TRP2-specific CD8+ T cells by IFN-γ ELISPOT assay. (I) Schematic illustrating the development of anti-PD-1 resistance (top) with pre- and post-anti-PD-1 RNAseq of relevant WNT ligand and Prostaglandin synthesis genes (below). (J) Treatment of the autochthonous BRAFV600EPTEN−/− melanoma model prior to (left) or following (right) anti-PD-1 escape with ETC-159 or TPST-1495 ± anti-PD-1. (K) Receiver-operator characteristic (ROC) curves predicting resistance to anti-PD-1 monotherapy in stage IV melanoma patients utilizing a GLI2 signature based on a Duke Nanostring dataset (left) and an external dataset (right). (L) Distribution of responding stage IV melanoma patients undergoing anti-PD-1 monotherapy according to Tcell:GLI2 signatures in an external data set. Data presented as mean±SEM. A-J: representative of 2–3 independent experiments. Data analyzed by two-way ANOVA (A-F, H, J). *p<0.05, **p<0.01, ***p<0.001, ****p<0.0001.

Update of

References

    1. Chockley PJ, Keshamouni VG. Immunological Consequences of Epithelial-Mesenchymal Transition in Tumor Progression. J Immunol 2016;197:691–8 - PMC - PubMed
    1. Wang L, Saci A, Szabo PM, Chasalow SD, Castillo-Martin M, Domingo-Domenech J, et al. EMT- and stroma-related gene expression and resistance to PD-1 blockade in urothelial cancer. Nat Commun 2018;9:3503. - PMC - PubMed
    1. Cristescu R, Nebozhyn M, Zhang C, Albright A, Kobie J, Huang L, et al. Transcriptomic Determinants of Response to Pembrolizumab Monotherapy across Solid Tumor Types. Clin Cancer Res 2022;28:1680–9 - PMC - PubMed
    1. Metropulos AE, Munshi HG, Principe DR. The difficulty in translating the preclinical success of combined TGFbeta and immune checkpoint inhibition to clinical trial. EBioMedicine 2022;86:104380. - PMC - PubMed
    1. DeVito NC, Sturdivant M, Thievanthiran B, Xiao C, Plebanek MP, Salama AKS, et al. Pharmacological WNT ligand inhibition overcomes key tumor-mediated resistance pathways to anti-PD-1 immunotherapy. Cell Rep 2021;35:109071. - PMC - PubMed

MeSH terms

Substances

LinkOut - more resources